

Frontend performance isn’t something you fix once and forget about. It’s a continuous process because:
- Browsers and technology evolve: Regular updates in Chrome, Firefox, and web standards (like Google’s shift from FID to INP in 2024) demand constant adjustments.
- User expectations change: Slow websites lose visitors. A 1-second delay can reduce conversions by up to 7%.
- Growing codebases create complexity: New features and outdated code can bloat your site, degrading performance over time.
Ignoring performance impacts your business. Slow sites drive users away, hurt SEO rankings, and reduce revenue. Regular audits, scalable coding practices, and performance budgets can help maintain speed and efficiency as your product grows. Treat performance as an ongoing priority – it directly affects user satisfaction and conversions.
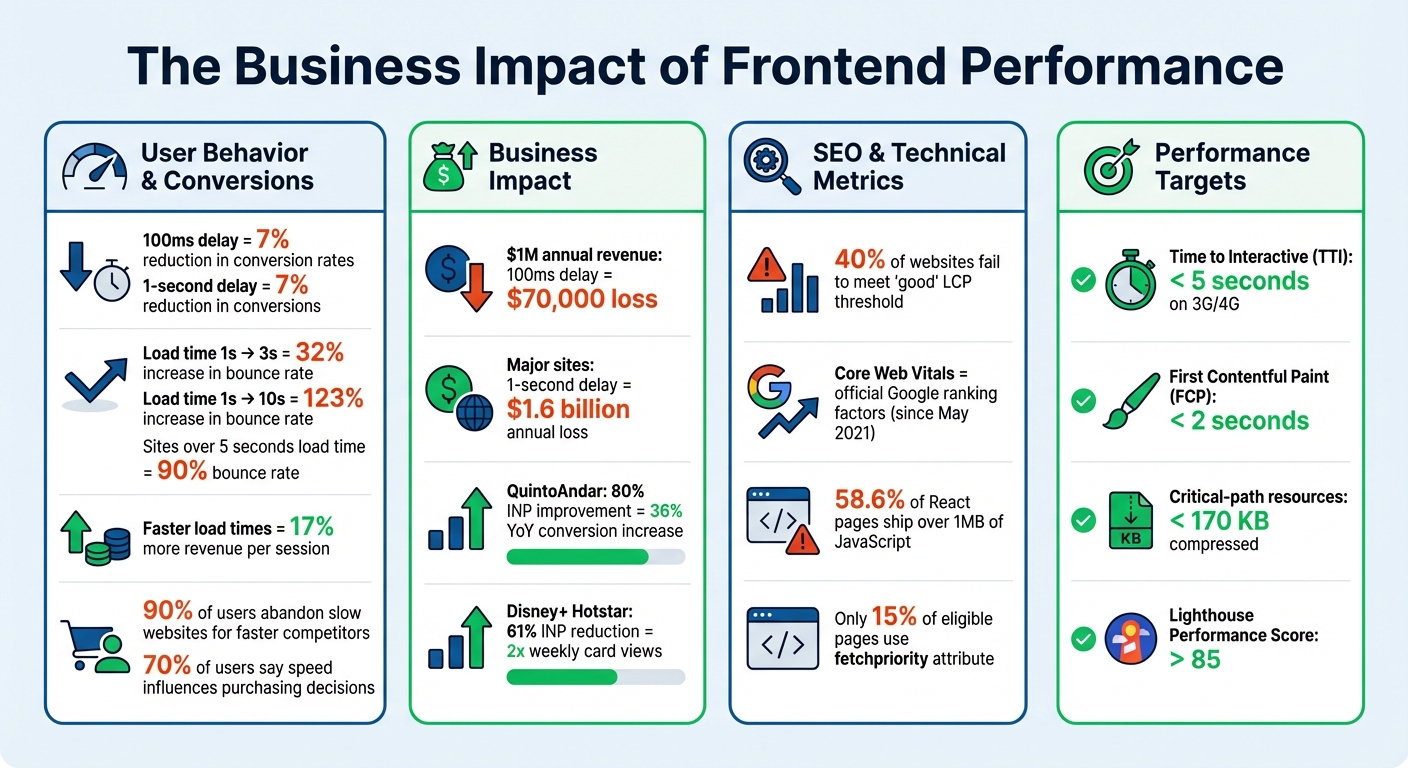
The Business Impact of Frontend Performance: Key Statistics on Speed, Conversions, and SEO
Frontend System Design: The 2025 Web Performance Roadmap
Why Frontend Performance Keeps Changing
Frontend performance is in constant flux because it operates within an ever-changing ecosystem. Browsers evolve, user devices vary widely, and your product itself grows more complex. These shifting elements mean that what worked perfectly a few months ago might now be a bottleneck. Let’s dive into the main drivers behind these changes.
Browser and Technology Updates
Browsers like Chrome and Firefox are updated frequently – sometimes monthly – bringing new features and optimizations that can impact how your code performs. For instance, Chrome publishes updated performance datasets (CrUX) every second Tuesday of the month, which often prompts developers to reassess their strategies [4][8]. Even web standards change; in March 2024, Google swapped First Input Delay (FID) for Interaction to Next Paint (INP) as a core ranking signal. This shift requires developers to focus on overall interaction responsiveness instead of just measuring initial delays [7].
Beyond metrics, browser engines introduce tools that can significantly improve performance. Take Chrome’s V8 engine, which added "script streaming." This feature allows async or defer scripts to be parsed in the background during download, improving load times by up to 10% [3]. New native APIs, like the loading="lazy" attribute for images or the fetchpriority attribute for resource prioritization, replace JavaScript-heavy solutions. Yet, adoption remains low – only 15% of eligible pages currently use fetchpriority to enhance their Largest Contentful Paint [7].
Real-world examples show how impactful these changes can be. In 2021, Netflix removed React and several libraries from its logged-out homepage, cutting over 200KB of JavaScript. This reduced the homepage’s Time-to-Interactive (TTI) by more than 50% [6]. It’s a clear reminder that reducing framework overhead can yield dramatic improvements in browser performance.
Changing User Expectations and Device Types
Your users expect speed, and their patience is razor-thin. A mere 100-millisecond delay in load time can slash conversion rates by 7% [10]. Sites that take more than five seconds to load risk bounce rates climbing as high as 90% [10]. On mobile, the stakes are even higher – users who experience faster load times generate 17% more revenue per session than the average user [8].
The devices users rely on are just as varied as their expectations. A browser’s capabilities don’t guarantee smooth performance on a low-end Android phone with limited CPU and RAM. While faster network speeds help, the time required to parse, compile, and execute JavaScript remains a major hurdle, especially for mobile users. Performance is never one-size-fits-all – what runs smoothly on your high-end laptop could struggle on your customer’s older device.
"Performance optimisation is not a one-time effort. Continuous monitoring and adjustments are inevitable to ensure your website remains efficient as technology and user expectations evolve."
Product Growth and Expanding Codebases
As your product grows, so does your codebase – and with it, the risk of performance degradation. Every new feature adds weight, and without regular audits, legacy code and unused dependencies can bloat your JavaScript bundles [3]. For example, 58.6% of React-based pages ship over 1 MB of JavaScript, far more than necessary [6]. Often, developers unknowingly include entire libraries when they only need a small portion, or they fail to remove outdated polyfills that modern browsers no longer require [3].
Etsy faced this challenge head-on. In 2021, Allison McKnight led the migration of their JavaScript build system from RequireJS to Webpack. This overhaul allowed the team to manage over 13,200 assets more efficiently, reducing production build times to an average of just 4 minutes [6][8]. It was part of a broader push to create a performance-focused culture that could adapt to ever-changing web standards.
Without safeguards, performance can spiral as teams juggle multiple frameworks. For instance, migrating from jQuery to React can increase CPU usage and memory demands. Pinterest tackled this by introducing custom ESLint rules that block developers from importing dependency-heavy files, ensuring new features don’t unintentionally bloat the application [4]. Without such measures, your performance baseline will slowly erode as your product scales.
The Business Cost of Ignoring Frontend Performance
Overlooking performance as an ongoing priority can seriously hurt your business. Even a slight delay in page load time – just 100 milliseconds – can reduce conversion rates by 7%. For a company earning $1 million annually, that seemingly tiny delay translates to a loss of about $70,000 in revenue[9]. On a larger scale, a one-second slowdown on a major site could result in losses as high as $1.6 billion per year[15]. These figures highlight how performance issues can impact not just user satisfaction but also your bottom line and search engine visibility.
User Retention and Conversion Rates
A website’s speed is often the deciding factor for whether users stay or leave. Slow-loading pages are a dealbreaker, especially for mobile users. For instance, if your load time increases from one second to three seconds, the likelihood of users bouncing jumps by 32%[15]. Push that to ten seconds, and the bounce rate skyrockets by 123%[15]. On the flip side, users who experience faster load times tend to spend more, generating 17% more revenue per session[3].
Consider the success stories of QuintoAndar and Disney+ Hotstar. QuintoAndar improved its Interaction to Next Paint (INP) by 80%, which led to a 36% year-over-year increase in conversions[11]. Disney+ Hotstar, by reducing INP by 61%, doubled weekly card views on living room devices[11]. These examples show how prioritizing performance can directly impact user engagement and revenue.
SEO Rankings and Visibility
Website performance isn’t just about user experience – it also plays a critical role in search engine rankings. Since May 2021, Google has incorporated Core Web Vitals – metrics like Largest Contentful Paint (LCP), First Input Delay (FID), and Cumulative Layout Shift (CLS) – as official ranking factors[4]. Poor performance not only frustrates users but also signals to search engines that your site may be of lower quality, pushing it further down in search results[12][13]. Shockingly, about 40% of websites fail to meet the "good" threshold for LCP, which directly harms their visibility[7].
"Improving loading times helps more users discover your business through organic search, as Google considers site speed a ranking factor."
Faster websites also enjoy better crawl rates. This means search bots can index more pages efficiently, ensuring that deeper content gets discovered and ranked. Neglecting performance is essentially leaving potential revenue untapped.
Examples of Performance Neglect
The consequences of ignoring performance optimization become painfully clear when businesses fail to adapt to changing user expectations and technology. Take Smashing Magazine, for example. In late 2020, they introduced a new navigation bar and an automated critical CSS system without proper ongoing monitoring. The result? Their Lighthouse scores dropped dramatically – article pages scored between 40 and 60, while the homepage ranged from 60 to 68. Founder Vitaly Friedman and his team found the root causes: a massive increase in DOM size and excessive main thread activity. Fixing these issues required months of effort, including overhauling CSS, fonts, and JavaScript bundling[14]. This setback happened because performance was treated as a one-time task instead of a continuous process.
"Performance optimization is one of the best (if not the best) ways of making your website make more money."
- Paweł Kowalski, Senior Performance Engineer, platformOS[16]
The message is clear: 90% of users will abandon a slow website in favor of a faster competitor, and 70% say that speed directly influences their purchasing decisions[9]. Failing to monitor and improve performance doesn’t just lead to technical debt – it actively drives away customers and drains revenue. Up next, we’ll dive into practical strategies to ensure your site remains fast and efficient over time.
sbb-itb-51b9a02
How to Maintain Frontend Performance Over Time
Keeping your frontend running smoothly isn’t a one-and-done task – it requires consistent effort and monitoring. Thankfully, modern tools make it easier to integrate performance checks into your workflow, turning them into a regular habit rather than a last-minute scramble. As your product grows and evolves, maintaining frontend performance is key to keeping users happy. Let’s dive into how regular audits, scalable coding practices, and clear performance budgets can help you stay on top of optimization.
Regular Performance Audits and Monitoring
Tracking performance involves two types of data: lab data and field data. Lab data comes from controlled tests using tools like Lighthouse, Chrome DevTools, or WebPageTest. These are great for debugging during development. Field data, on the other hand, captures real-world user experiences through tools like Real User Monitoring (RUM) and the Chrome User Experience Report (CrUX). For example, PageSpeed Insights considers an experience "good" if 75% of users meet the target for a specific metric [17].
To prevent performance regressions, integrate tools like Lighthouse CI and the WebPageTest API into your CI pipeline. This way, every commit gets checked automatically [23, 26]. Chrome DevTools also offers a "Live Metrics" view, which tracks Core Web Vitals in real time as you interact with the page [17].
For ongoing monitoring, automate your data collection. Tools like AutoWebPerf and SpeedTracker can pull metrics from multiple sources – such as CrUX and PageSpeed Insights – and display them in unified dashboards [1]. Don’t forget to regularly review third-party scripts, as elements like GDPR prompts or analytics widgets can hurt Core Web Vitals if left unchecked [1].
Scalable Optimization Techniques
Once you’ve gathered performance metrics, it’s time to fine-tune your codebase with proven techniques.
- Code splitting: Break your code into smaller chunks using tools like Webpack’s
splitChunks. This ensures only the necessary parts load, improving efficiency [3]. Granular splitting, which separates individual node modules, can also boost caching [3]. - Lazy loading: Reduce your initial page weight by deferring non-essential resources. For example, load heavy components like chat widgets or video embeds only when a user interacts with them [3]. For images, modern formats like AVIF can achieve up to 50% smaller file sizes compared to WebP and JPEG while maintaining quality [5]. Use tools to serve AVIF/WebP images and reserve space with the
aspect-ratioproperty [14, 8]. - Differential serving: Serve modern ES2017+ JavaScript to capable browsers while offering transpiled builds for older ones [6, 14].
- Offloading tasks: Shift resource-intensive operations to Web Workers or WebAssembly to keep the main thread responsive and avoid UI lag [3].
Real-world examples show how these strategies work at scale. Pinterest, for instance, created custom ESLint rules to prevent developers from importing large, dependency-heavy files, helping them stick to performance budgets [3, 11]. Similarly, Welt.de adopted partial hydration with Preact, sending only small JavaScript chunks for specific interactive elements instead of the entire app [3].
Setting Performance Budgets
A performance budget acts as a safeguard, ensuring that new features or assets don’t compromise user experience [18]. It provides clear limits for things like high-resolution images or additional libraries. Without these boundaries, performance can gradually degrade as complexity grows.
Set both "Warning" thresholds (to plan for tech debt) and "Error" thresholds (to block changes that harm performance) [25, 29]. To establish a competitive edge, analyze about 10 competitors, identify the fastest site in your niche, and aim to be at least 20% faster [30, 11]. Research shows that users typically notice performance improvements only when response times change by more than 20% [30, 11].
For a solid baseline, aim for a Time to Interactive (TTI) under 5 seconds on a 3G/4G connection to reduce bounce rates [25, 28]. On slower networks or budget devices, keep compressed, minified critical-path resources under 170 KB [28, 30].
| Metric Type | Example Metric | Recommended Goal (Slow 3G) |
|---|---|---|
| Milestone Timing | Time to Interactive (TTI) | < 5 seconds [28, 30] |
| Milestone Timing | First Contentful Paint (FCP) | < 2 seconds [2] |
| Quantity-based | Critical-path JS/CSS | < 170 KB [28, 30] |
| Rule-based | Lighthouse Performance Score | > 85 [19] |
Automate enforcement by integrating tools like bundlesize for file size limits or Lighthouse CI for milestone timings into your CI/CD pipeline [25, 28]. A great example comes from Experian, which started including site speed in their monthly executive KPI reports back in 2019. By doing so, they made performance a company-wide priority, ensuring accountability across all departments – not just the development team [2].
Aligning Performance with Product Growth Stages
Tailor your performance strategy to evolve alongside your product’s growth. Scaling optimization efforts should align with the stage of your product’s lifecycle.
Performance Priorities for MVPs
When working on a Minimum Viable Product (MVP), focus on quick, impactful improvements to boost speed. Start by minifying JavaScript and CSS files, using a CDN for static assets, placing CSS in the <head>, and deferring nonessential scripts to avoid blocking the initial page render.
For images, compress them to 60–90% quality. Most users won’t notice the difference in quality, but the bandwidth savings can be substantial. Use lazy loading (loading="lazy") for images that appear below the fold. At this stage, prioritize metrics like First Contentful Paint (FCP) to ensure early users see content loading promptly. Meeting mobile users’ expectations for load times is especially critical.
As your product grows beyond the MVP stage, more advanced performance strategies become necessary to handle increased demands.
Optimization for Scaling Products
As your user base and codebase expand, it’s time to invest in architectural upgrades. Implement Server-Side Rendering (SSR) to deliver content faster and improve SEO. Use code splitting to break large JavaScript bundles into smaller, on-demand chunks.
For example, Netflix demonstrated how reducing JavaScript libraries significantly improved their Time-to-Interactive (TTI) [6]. At this stage, focus on interactivity metrics like Interaction to Next Paint (INP) and TTI. Introduce performance budgets into your CI/CD pipeline to catch and prevent regressions as new features are deployed [2]. Advanced techniques, such as differential serving and offloading heavy tasks to Web Workers or WebAssembly, can also enhance performance.
"Website performance is a lot like getting fit: it’s not enough to make a one time effort; you have to change your lifestyle."
- Chris Anstey and Bojan Pavic, web.dev [2]
Below is a summary of performance priorities across different growth stages:
| Feature | MVP Priority | Scaling Priority |
|---|---|---|
| Rendering | Client-Side Rendering (CSR) | Server-Side Rendering (SSR) / Static Site Generation (SSG) [20][23] |
| JS Loading | Basic defer/async |
Code Splitting & Dynamic Imports [21][3] |
| Images | Basic Compression & Lazy Loading | Responsive Images (srcset) & Modern Formats (WebP/AVIF) [22][23] |
| Monitoring | Lab Data (Lighthouse) | Field Data (CrUX) & Real User Monitoring (RUM) [22] |
| Governance | Manual Audits | Automated Performance Budgets in CI/CD [2] |
Conclusion: Treating Performance as a Continuous Priority
When it comes to frontend performance, it’s not a "set it and forget it" situation – it’s an ongoing effort. And the stakes are high. Users tend to abandon websites that take more than two seconds to load, and shaving off just 100 milliseconds can bump up sales by 1% [24]. That’s not just a statistic; it’s real money slipping through the cracks.
As your product evolves, performance naturally takes a hit. Without regular monitoring and fine-tuning, today’s blazing-fast website can turn into tomorrow’s slow and frustrating experience. Lara Hogan from Etsy captures this perfectly:
"Performance more often comes down to a cultural challenge, rather than simply a technical one" [24].
Creating a culture that values speed isn’t just about the developers – it’s a team-wide effort. The best companies make performance metrics visible to everyone, from engineers to executives. They integrate performance budgets and site speed metrics into their workflows, ensuring these practices aren’t just temporary fixes but part of their core operations [2]. This mindset helps them stay ahead as their products grow and change.
You don’t have to tackle everything all at once. Start small. Add performance budgets to your CI/CD pipeline to catch issues before they hit production. Use Real User Monitoring (RUM) to understand how visitors experience your site across different devices and networks. Automate audits so performance checks become as routine as code reviews. These small, steady improvements can lead to meaningful results over time.
FAQs
Why isn’t frontend performance optimization a one-time task?
Frontend performance optimization is a never-ending task because the web is constantly evolving. Changes like browser updates, new frameworks, or third-party tools can introduce unexpected slowdowns. At the same time, users demand faster, smoother experiences than ever before. What works well today might feel outdated and sluggish in just a few months without regular maintenance.
To keep up, teams often define clear performance targets – like keeping load times under 5 seconds on slower networks – and bake these goals into their development process. Using tools for continuous monitoring and analyzing real-user metrics can help catch and fix problems before they affect the user experience. As your product grows – whether through new features, increased traffic, or support for more devices – routine performance checks and tweaks are crucial to ensure everything runs smoothly.
In essence, optimizing your site isn’t a one-and-done effort. It’s an ongoing commitment to delivering fast, reliable, and seamless experiences in a digital world that never stands still.
How do browser updates affect frontend performance?
Modern browsers are constantly evolving, and their updates can have a noticeable effect on frontend performance. These updates often include improvements like faster JavaScript processing, smarter memory usage, and more efficient rendering. The best part? These enhancements can boost your site’s performance without you having to tweak a single line of code. New features, such as native lazy-loading or support for WebP images, also open the door for developers to implement faster and more streamlined solutions.
But it’s not all smooth sailing. Browser updates can sometimes introduce challenges. For instance, changes in security policies or updated standards might disrupt the performance of pages that were previously optimized. That’s why keeping a close eye on performance is so important. Regularly running audits after browser updates can help you spot and fix potential slowdowns before they affect your users. Staying ahead of these changes ensures your site remains fast, dependable, and ready to deliver a seamless experience.
How can you maintain frontend performance as your product grows?
To maintain strong frontend performance as your product grows, it’s essential to focus on consistent monitoring, establishing performance budgets, and making gradual improvements. Tools like Lighthouse and WebPageTest can help you keep an eye on key metrics, such as Core Web Vitals (LCP, FID, CLS). Pair these with real-user monitoring (RUM) to get a clearer picture of how users experience your site across various devices and network conditions.
Set clear performance budgets – for instance, keeping total JavaScript under 150 KB or ensuring pages load within 5 seconds on a 3G connection. Treat these limits seriously; if they’re exceeded, handle it as you would a failed build. Reassess these thresholds regularly, especially when introducing new features, to ensure they remain relevant.
When it comes to optimizations, focus on scalable strategies like code splitting, lazy-loading assets, leveraging a CDN for faster content delivery, optimizing images, and refining the critical rendering path. A steady, disciplined approach will help your product stay fast, dependable, and enjoyable for users as it evolves.


Leave a Reply