

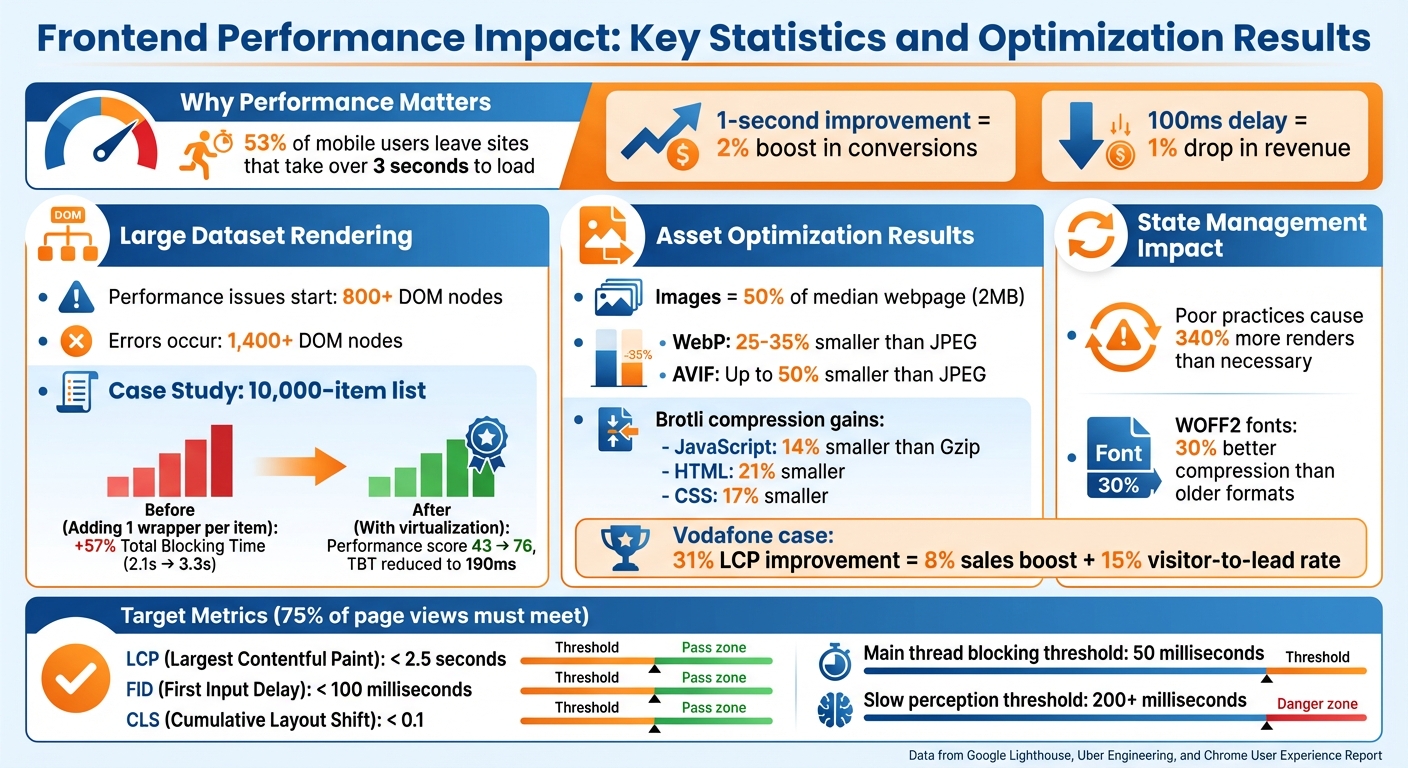
When building data-heavy web apps, performance is critical. Poor performance leads to slow load times, unresponsive interfaces, and frustrated users. Studies show that 53% of mobile users will leave a site if it takes over 3 seconds to load, and even a 1-second improvement in load time can boost conversions by 2%. Here’s what typically slows down these apps and how to fix it:
- Rendering Large Datasets Inefficiently: Avoid rendering thousands of DOM nodes at once. Use virtualization tools like
react-windowor pagination to improve responsiveness and reduce memory usage. - Too Many API Calls and Overfetching: Minimize redundant requests, use caching libraries like TanStack Query, and switch to GraphQL or efficient REST endpoints to fetch only necessary data.
- Unoptimized Asset Loading: Serve modern image formats (e.g., WebP), use lazy loading for offscreen content, and compress JavaScript with Brotli to speed up page loads.
- Poor State Management: Prevent unnecessary re-renders by memoizing selectors, localizing state, and flattening nested data structures.
- Blocking the Main Thread: Offload heavy computations to Web Workers and break up large tasks to keep the app responsive.
Performance isn’t just about speed – it directly impacts user retention and revenue. By addressing these common issues, you can ensure your app is fast, efficient, and user-friendly.
Frontend Performance Impact: Key Statistics and Optimization Results
Rendering Large Datasets Inefficiently
Causes and Impact
When thousands of rows are rendered, a separate DOM node is created for each item. According to Google Lighthouse, performance issues start appearing when the number of nodes exceeds 800, and errors often occur beyond 1,400 nodes[2]. Many apps handling large datasets ignore these thresholds, leading to serious performance slowdowns.
The situation becomes worse when the app performs a full dataset re-render every time there’s a change. A technical study by Uber Engineering demonstrated this with a list of 10,000 elements. Adding just one extra wrapper to each item increased the Total Blocking Time from 2.1 seconds to 3.3 seconds – a 57% jump that significantly hurt responsiveness[6].
Poorly optimized rendering can also push browser memory usage into the gigabyte range[3]. This can result in sluggish scrolling, delayed click responses, and even browser crashes. Mobile devices, which typically have fewer resources, are particularly vulnerable to these issues.
Improving rendering techniques is critical to avoid these performance pitfalls.
Solutions
Virtualization tools like react-window, react-virtuoso, or vue-virtual-scroller provide an effective way to handle large datasets. These tools render only the visible items along with a small buffer, keeping the number of DOM nodes consistent regardless of the dataset size. In the same Uber study, applying virtualization to a 10,000-item list boosted the Lighthouse performance score from 43 to 76 and reduced the Total Blocking Time to just 190 milliseconds[6]. This method also stabilizes memory usage and ensures smooth scrolling.
Memoization is another powerful optimization technique. By wrapping components in React.memo or using Vue‘s v-memo, unnecessary re-renders can be avoided. These tools ensure components only update when their props change, reducing the workload during reconciliation. Additionally, using stable keys – such as unique database IDs instead of array indices – helps frameworks efficiently track and update only the elements that have changed[8].
For datasets that don’t require infinite scrolling, pagination offers a straightforward solution. By loading 20 to 50 items at a time, users can navigate through smaller, manageable pages. This approach keeps the number of DOM nodes low and reduces memory usage, making it a practical choice for scenarios like administrative dashboards or search results[5][7].
Too Many API Calls and Overfetching Data
Common Issues
Polling loops can be a major drain on resources in data-heavy apps. Instead of using WebSockets or Server-Sent Events (SSE) for real-time updates, many apps rely on polling, which generates constant network traffic and puts unnecessary stress on backend systems [9].
Redundant requests are another common problem. When multiple components independently fetch the same data, it leads to duplicate API calls. Without effective request deduplication or client-side caching, apps can overload endpoints. For example, Twitter’s home page can send roughly 300 requests, while Amazon‘s product pages may hit up to 600 requests, including 100 for asynchronous data fetching [11].
Overfetching happens when queries pull in more data than needed. For instance, broad queries like SELECT * or fetching deeply nested objects can waste bandwidth and slow down time-to-interactive (TTI). On a 3G connection, payloads should ideally stay under 1.6MB to avoid delays. Juntao Qiu, a Software Engineer at Atlassian, highlights the issue:
"Remote calls can be slow, and it’s essential not to let the UI freeze while these calls are being made" [11].
Rapid-fire API calls, often triggered by typing or scrolling, can overwhelm the network, creating bottlenecks and degrading performance.
These problems call for smarter solutions to optimize data handling and maintain a smooth, responsive user experience.
Solutions
Tackling these challenges involves smarter caching, precise data queries, and controlling the frequency of API calls.
Caching libraries like TanStack Query or SWR can significantly improve performance. These tools manage request deduplication, serve cached data instantly, and fetch updates in the background. They also handle loading and error states, ensuring the UI remains responsive and smooth.
GraphQL is a powerful tool for avoiding overfetching. It allows you to request only the specific fields your UI needs. For REST APIs, creating custom aggregation endpoints can bundle related data into a single response, reducing the need for multiple calls.
Pagination is crucial when working with large datasets. Using techniques like limit/offset or cursor-based pagination helps keep payloads small and prevents memory overload. Retool suggests keeping the number of queries on page load below seven to achieve a TTI under five seconds [10].
Debouncing and throttling are effective ways to manage API call frequency. Debouncing waits until the user stops typing before making a request, while throttling limits the number of API calls during continuous actions like scrolling. Both strategies help reduce unnecessary network traffic.
| Issue | Cause | Recommended Solution |
|---|---|---|
| Network Congestion | Polling, redundant calls | WebSockets, SSE, Request Deduplication |
| Slow TTI | Large initial payloads | Pagination, Server-side filtering |
| Overfetching | SELECT *, nested objects |
GraphQL, Field selection |
| UI Jitter | Rapid-fire input triggers | Debouncing, Throttling |
| Stale Data | Poor cache management | SWR, TanStack Query, Cache Invalidation |
Loading Assets Without Optimization
Common Mistakes
Beyond fetching data and rendering content, properly handling assets is a key part of ensuring smooth performance. Unoptimized assets can slow down page loads significantly. Images alone make up nearly half of the median webpage’s 2MB transfer size [14], and for more than 70% of webpages, the Largest Contentful Paint (LCP) score heavily depends on how quickly images load [14].
One common issue is serving high-resolution images to devices with small screens, which unnecessarily burdens mobile users. Using older formats like JPEG or PNG can also inflate file sizes by 25–50%, and skipping width/height attributes leads to layout shifts [14][17].
Font loading can create similar challenges. Loading too many font styles, sticking to outdated formats like TTF instead of WOFF2, and failing to subset fonts all add avoidable weight. As Bram Stein noted in the 2022 Web Almanac:
"In fact, we think it is also time to proclaim: Use only WOFF2 and forget about everything else" [15].
JavaScript bundles are another culprit. Delivering large, monolithic bundles without code-splitting means users often download entire libraries just to use a single function. Loading scripts synchronously blocks rendering, leaving users staring at a blank screen. Alarmingly, about 60% of HTTP responses still lack text-based compression [16].
Solutions
Switch to modern formats like WebP or AVIF for images. WebP reduces file sizes by 25–35% compared to JPEG, while AVIF can cut sizes by up to 50% [17]. For fonts, WOFF2 offers roughly 30% better compression than older formats [15][17]. On the server side, enable Brotli compression for all text-based assets. This makes JavaScript files 14% smaller than Gzip, while HTML and CSS files benefit from 21% and 17% reductions, respectively [17].
Responsive images are critical. Use the srcset attribute and <picture> element to serve images tailored to the user’s device resolution. Vodafone, for example, saw a 31% improvement in LCP, which translated into an 8% boost in sales and a 15% increase in their visitor-to-lead rate [14]. Similarly, Etsy enhanced their LCP timing by around 4% by adding fetchpriority="high" to their main hero images [1].
Lazy loading is another effective strategy. Apply loading="lazy" to offscreen images so they only load when users scroll near them. This ensures above-the-fold images load quickly, improving LCP [14].
For JavaScript, code-splitting with dynamic imports can break large bundles into smaller, more manageable chunks that load only when needed. Adding async or defer attributes to scripts prevents them from blocking the main thread. Chrome DevTools’ "Coverage" tool can also help identify unused CSS and JavaScript, allowing you to remove unnecessary code [17].
Lastly, use resource hints to speed up asset loading. Add rel="preload" for critical fonts or scripts, and rel="preconnect" for third-party origins. As web.dev wisely notes:
"The fastest image request will always be the one that never gets made" [14].
Optimizing your assets is a crucial part of the larger strategy for improving performance, alongside efficient data handling and rendering.
Poor State Management Causing Unnecessary Re-renders
Challenges
State management problems can wreak havoc on performance, especially in data-heavy applications. In React, inefficient practices like using non-memoized selectors (e.g., .filter() and .map() inside a Redux useSelector) or creating objects and functions directly within JSX can lead to 340% more renders than necessary [23][18][21]. These extra renders happen because such patterns trigger updates in child components, even when they aren’t needed.
Another common issue is global state bloat, where UI-specific or localized data is stored in a global state. This causes unrelated parts of the app to re-render whenever that state changes [22]. To make matters worse, prop drilling – passing state through multiple layers of components – forces intermediate components to update, even if they don’t actually use the data [22].
Vue applications face their own challenges. Vue’s deep reactivity system can create significant overhead when working with large, nested structures. For example, accessing properties in datasets with over 100,000 entries triggers dependency tracking for every property, slowing things down [12]. Additionally, storing deeply nested API responses instead of flattening the data can lead to cascading re-renders across the component tree whenever a mutation occurs [19].
Solutions
Managing state effectively is just as important as optimizing rendering and asset loading when it comes to keeping data-heavy apps running smoothly. Here’s how to tackle these challenges:
- Flatten Nested Data: Use tools like
normalizror Redux Toolkit‘screateEntityAdapterto normalize your state structure [18][19]. This isolates updates to specific entities, preventing a small change from causing widespread re-renders. - Memoized Selectors: Employ utilities like Reselect‘s
createSelectorto create memoized selectors. These ensure that new references are only returned when dependencies actually change. As the Redux documentation puts it:
"It’s always up to your reducers to decide if any state actually needs to be updated, and ‘nothing needs to happen’ is a valid decision for a reducer to make" [18].
- Selective Reactivity in Vue: For large, read-only data structures, use Vue’s
shallowRef()orshallowReactive()to avoid the overhead of deep dependency tracking [12]. - Localize State: Keep state within the components that need it. In React, use hooks like
useCallbackanduseMemoto stabilize function and object references, reducing unnecessary updates [20][21][22]. - Batch Updates: Group related state updates together to minimize reconciliation cycles. React 18’s
startTransitionfeature can also help by marking non-urgent updates, keeping the UI responsive during heavy rendering [25]. - Offload Heavy Computations: Move CPU-intensive tasks like sorting or filtering large arrays to Web Workers. This prevents the main UI thread from being blocked and keeps the app responsive.
Blocking the Main Thread with Heavy Computations
Causes
The browser’s main thread is responsible for crucial tasks like parsing HTML/CSS, running JavaScript, and handling user interactions. When a task takes more than 50 milliseconds, it can block this thread, causing the UI to freeze and frustrating users [26][27].
In data-heavy applications, several common issues can hog the main thread. For instance, large JavaScript bundles take time to download, parse, compile, and execute, leaving users stuck on an unresponsive page [26][28]. Frameworks like Next.js can also cause delays during hydration, as the browser processes large JSON payloads to enable interactivity [26]. In Vue, deep reactivity on large, nested arrays can lead to significant overhead due to exhaustive dependency tracking [12]. Additionally, monolithic functions that combine tasks like validation, UI updates, and analytics can block the browser from handling user interactions [27].
The impact of these delays is immediate and noticeable. While delays under 50 milliseconds might go unnoticed, anything over 200 milliseconds makes a site feel slow and unresponsive [29]. This directly affects the Interaction to Next Paint (INP) score, which tracks the time between a user action and the next visual update [26][4].
Solutions
Heavy computations, like rendering and data fetching, can severely affect responsiveness by blocking user interactions. To address this, break up lengthy tasks using techniques like scheduler.yield() or setTimeout(0) to give the browser a chance to handle high-priority events [26][27].
Another effective approach is to offload intensive computations to Web Workers. Tasks such as data processing, sorting large arrays, or decoding assets can run in background threads, keeping the main thread available for UI updates and interactions [26][29].
For frameworks like Vue, using shallow reactivity (shallowRef or shallowReactive) for large, immutable data structures can reduce performance overhead by avoiding deep proxy traps [12]. Additionally, pre-compiling templates during the build process can reduce bundle size by approximately 14KB, further improving performance [12].
sbb-itb-51b9a02
10 FrontEnd Performance Tips To Improve Your Application (Any Programming Language)
Tools for Measuring and Monitoring Performance
To fine-tune your application’s performance, you need accurate measurement tools. As Ilya Grigorik from Google wisely notes:
"The foundation of every solid performance strategy is good measurement and instrumentation. You can’t optimize what you can’t measure." [35]
In practice, this means using a mix of tools to identify performance bottlenecks during development and monitor how real users interact with your application.
Recommended Tools
Lighthouse is an excellent starting point for performance audits. Built into Chrome DevTools, it runs synthetic tests in a controlled environment, scoring your app on Performance, Accessibility, SEO, and Best Practices (on a scale of 0 to 100) [31][33]. It pinpoints issues like unoptimized images or render-blocking scripts. For example, the "Largest Contentful Paint element" audit reveals which image or text block is slowing down your perceived load time [31].
For more detailed debugging, the Chrome DevTools Performance Panel offers a comprehensive trace of your page’s activity, including network requests, JavaScript execution, and rendering tasks [32][36]. This tool is particularly useful for identifying "Long Tasks" – those exceeding 50 milliseconds – that can cause UI freezes.
PageSpeed Insights (PSI) combines lab data with real-user metrics from the Chrome User Experience Report (CrUX) [32]. This provides a balanced view of both controlled testing and real-world performance across various devices and network conditions. To track real-user metrics directly, the Web Vitals library can be integrated into your application, sending data to your analytics endpoints [32][34].
For automation, Lighthouse CI is a powerful tool to enforce performance budgets in your CI/CD pipeline. You can configure it to fail builds if your app exceeds predefined limits, such as a maximum JavaScript bundle size or minimum performance score [32][34]. For instance, you might set a strict 170KB gzipped limit for JavaScript bundles [34]. To complement this, Webpack Bundle Analyzer visualizes your bundle sizes, helping you identify dependencies that might be inflating your application unnecessarily [34].
Comparison Table
Here’s a quick comparison to help you decide which tool fits your needs:
| Tool | Type | Best For | Key Metrics Tracked | Setup Ease |
|---|---|---|---|---|
| Lighthouse | Lab (Synthetic) | Development audits and identifying practices | LCP, TBT, CLS, SEO, Accessibility | Built into Chrome DevTools [33] |
| CrUX / PSI | Field (RUM) | Understanding real-world user experiences | LCP, FID, CLS, INP | Requires CrUX dataset or PSI API [32] |
| DevTools Performance | Lab (Trace) | Debugging main-thread and UI issues | Main thread activity, JS stacks, layout shifts | Built into Chrome DevTools [33] |
| Lighthouse CI | Automation | Preventing regressions in CI/CD pipelines | Performance budgets, audit scores | Requires CI/CD integration [32][34] |
| Web Vitals Library | Programmatic | Custom RUM implementations | All Core Web Vitals (LCP, INP, CLS) | Requires JavaScript integration [32][34] |
Key Metrics and Thresholds
To meet Google’s performance standards, at least 75% of page views must fall within the "Good" range for each Core Web Vital [34]. This means:
- Largest Contentful Paint (LCP): Under 2.5 seconds
- First Input Delay (FID): Under 100 milliseconds
- Cumulative Layout Shift (CLS): Below 0.1 [34]
While tools like Lighthouse are great for debugging during development, real-user data from CrUX or RUM tools provides a clearer picture of how your application performs in real-world scenarios. Combining these tools ensures you can systematically address performance challenges and deliver a smooth user experience [32].
Best Practices for Building Scalable Data-Heavy Apps
Key Takeaways
Creating scalable, data-heavy applications demands a well-organized, step-by-step strategy. AlterSquare‘s I.D.E.A.L. framework – Identify, Diagnose, Execute, Assess, Learn – provides a structured way to tackle performance challenges. This approach breaks down the process into manageable phases, helping your development team focus on improvements without feeling overwhelmed.
Start with server-side rendering (SSR) and streaming as your foundation. SSR reduces the load on users’ devices and improves time to first byte (TTFB) [37]. Modern frameworks also allow for HTML streaming, where parts of the UI are sent to the client as soon as they’re ready, instead of waiting for the entire page to load [13][37]. This keeps users engaged while the remaining data loads in the background. These server-side techniques work hand-in-hand with ongoing client-side optimizations.
Beyond initial rendering, ongoing maintenance is critical. Tools like service workers play a vital role by caching assets and data locally. This ensures near-instant subsequent loads and even offline functionality – particularly valuable during network disruptions or traffic surges [37][38]. To stay ahead of potential issues, use tools like Chrome DevTools, Lighthouse, and Real User Monitoring (RUM) for continuous profiling and bottleneck detection [1][12]. As MDN Web Docs succinctly puts it:
"Performance means efficiency" [30].
Efficiency, however, doesn’t happen by accident – it’s achieved through consistent measurement and iteration.
Another essential step is enforcing performance budgets. For example, keep JavaScript bundles under 170KB (gzipped) to maintain low load times. Statistics show that 53% of mobile users abandon a site if it takes longer than 3 seconds to load, and even shaving off 1 second can increase conversions by 2% [1][34]. Setting and adhering to these limits ensures your app remains fast, even as new features are added.
Conclusion
In data-heavy web applications, performance isn’t just a technical concern – it’s a business-critical factor. A delay of just 100 milliseconds can lead to a 1% drop in revenue [40], and over half of mobile users – 53%, to be exact – will abandon a site if it takes more than three seconds to load [39]. These numbers highlight how closely tied performance is to business success.
While quick fixes can address immediate issues, developing a mindset that prioritizes performance is equally important. Techniques like list virtualization for managing large datasets, batching and caching API requests, using modern image formats with lazy loading, memoizing components to prevent unnecessary re-renders, and leveraging Web Workers for intensive tasks have proven to boost both speed and revenue. Companies like Etsy and Walmart have seen measurable benefits from these strategies [1]. These practices not only enhance application performance but also encourage a proactive approach to optimization across teams.
Establishing performance budgets, consistently tracking real user metrics, and making speed a priority from the very beginning can save significant time and resources. It’s far easier to embed performance into the development process than to tackle technical debt later [24]. As Daniel Brown, Lead DevOps Engineer, aptly states:
"In a world where users expect more than ever, proactive performance management isn’t just a nice-to-have, it’s a must" [40].
At AlterSquare, we specialize in creating scalable, high-performing digital solutions tailored for data-intensive applications. With our I.D.E.A.L. framework and expertise in modern frontend architecture, we help ensure your applications deliver fast, seamless user experiences. Whether you’re building a new MVP or upgrading an existing platform, our technical knowledge and strategic insights can help you sidestep common performance hurdles and create products that grow with your business.
FAQs
What are the best ways to efficiently render large datasets in a web app?
To handle large datasets efficiently, focus on rendering only what’s visible to the user. Methods like pagination, infinite scrolling, or list virtualization (using tools like react-window or react-virtualized) can significantly cut down the number of DOM elements, ensuring smooth performance even when dealing with thousands of items.
Another key strategy is to fetch and process data in smaller, manageable chunks. Server-side pagination or APIs that deliver data incrementally (e.g., 20–50 records at a time) can help. Simplify your data structures by normalizing and flattening them to avoid slowdowns caused by deeply nested objects.
Lastly, minimize unnecessary re-renders. Use tools like React.memo to memoize components, and hooks like useCallback or useMemo to stabilize functions. For frequent updates, such as search inputs, apply throttling or debouncing techniques. If you’re dealing with heavy computations, offload the work to a Web Worker to keep the UI responsive. Regularly use tools like React DevTools or browser performance analyzers to identify and fix bottlenecks for a smoother user experience.
How can I reduce unnecessary API calls in data-heavy web apps?
To cut down on unnecessary API calls, a good starting point is caching. By storing data that doesn’t need constant fetching, you can save resources and improve performance. Tools like React Query can manage client-side caching efficiently, allowing responses to be reused within a specified time frame. Browser and service-worker caches are also great options. Additionally, HTTP headers like ETag can help prevent redundant requests by validating cached responses.
Another effective approach is to debounce or throttle user actions, such as typing in search fields or scrolling. This ensures that only a single request is sent after a brief delay, avoiding excessive API calls. Similarly, batching related requests into a single payload – using GraphQL or REST batch endpoints – can consolidate multiple calls into one. For even more efficiency, consider conditional fetching, where data is only fetched when it’s truly needed, such as when a component becomes visible on the screen.
Using smart data-loading patterns can also make a big difference. Prefetch likely-needed data, fetch independent resources in parallel, or use pagination to limit the amount of data retrieved at once. Tools like Chrome DevTools and Lighthouse are invaluable for spotting and optimizing redundant API calls. These methods not only reduce backend strain but also improve overall performance and create a smoother user experience.
How do modern image formats enhance the performance of data-heavy web apps?
Modern image formats like WebP, AVIF, JPEG XL, and SVG are game-changers for web app performance. They deliver crisp, high-quality visuals while keeping file sizes impressively small. Take WebP, for instance – it can shrink file sizes by 30–40% compared to older formats like JPEG or PNG, all while maintaining comparable image quality. Meanwhile, SVG, as a vector-based format, scales effortlessly to any resolution without bloating the file size. This eliminates the hassle of creating multiple versions for high-DPI screens.
Using smaller image files doesn’t just save storage – it speeds up load times, enhances Largest Contentful Paint (LCP) metrics, and boosts the overall performance of apps packed with visual content. Plus, it reduces bandwidth usage, making apps more accessible for users on slower networks or mobile devices. By adopting these formats, startups can deliver fast, visually stunning, and scalable user experiences without sacrificing performance.


Leave a Reply