
The Hidden Complexity in Multi-Agent Orchestration That Every Demo Skips Over
Huzefa Motiwala April 28, 2026
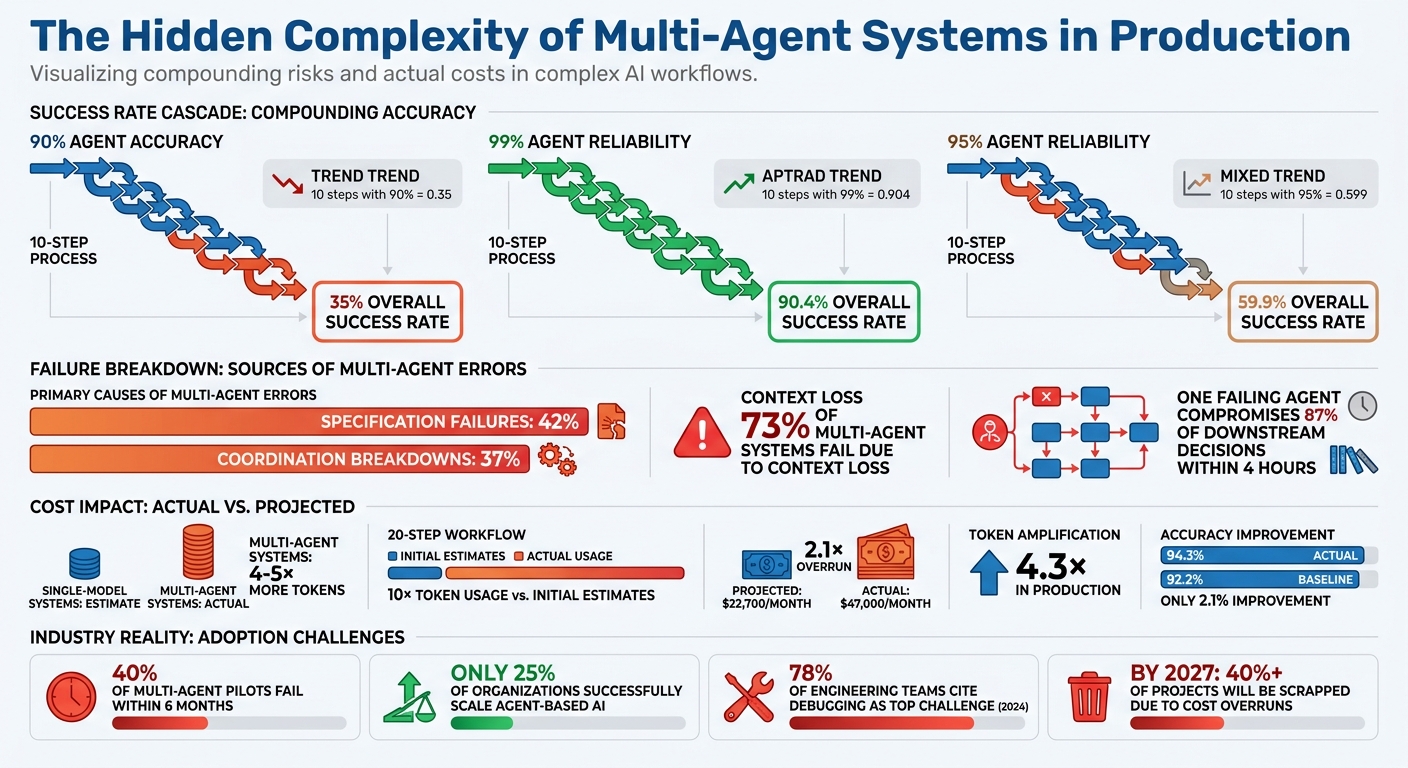
Multi-agent systems often look flawless in demos, but transitioning them to production reveals significant challenges. These systems struggle with compounded error rates, coordination failures, context loss, and skyrocketing costs. For example, a 10-step process with 90% agent accuracy results in only a 35% overall success rate. Issues like deadlocks, cascading failures, and token bloat further complicate operations.
Key takeaways for managing these challenges include:
- Coordination Issues: Use timeouts, state checkpointing, and JSON schemas to reduce agent conflicts and deadlocks.
- Cascading Failures: Implement isolation protocols, retry logic, and semantic verification gates to prevent one failure from derailing the entire pipeline.
- Observability: Adopt trace IDs and tools like OpenTelemetry to track decision chains and debug effectively.
- Context Management: Use summarization, event sourcing, and observation masking to maintain clarity and reduce token usage.
- Cost Control: Apply model tiering, prompt caching, and budget guards to manage token amplification and workflow expenses.
While multi-agent systems promise efficiency, achieving reliable production performance demands careful engineering and monitoring.
Multi-Agent System Production Challenges: Key Statistics and Success Rates
From Chaos to Choreography: Multi-Agent Orchestration Patterns That Actually Work – Sandipan Bhaumik
sbb-itb-51b9a02
Agent Coordination and Conflict Resolution
When agents work together, conflicts are almost inevitable. For instance, one agent might approve a refund while another flags the same transaction as fraudulent. Or, a research agent might pull data that contradicts a plan already finalized by another agent. In controlled demos, these issues are resolved instantly by a perfectly tuned orchestrator. But in real-world production, they can lead to silent failures that disrupt entire workflows.
Common Coordination Failure Modes
Agent deadlocks occur when two agents are stuck waiting on each other. For example, Agent A waits for a response from Agent B, while Agent B is simultaneously waiting on Agent A. This circular dependency can grind operations to a halt without any obvious signs. Another version of this happens when an agent locks a resource (like a database connection) but crashes before releasing it, leaving other agents indefinitely blocked [5][6]. As one engineering team explains:
"Deadlock almost never looks like a loud outage. More often, it is a silent progress stop that consumes workers and budget." – Agent Patterns [5]
Orchestrator decision loops are another issue, where a manager agent keeps assigning the same task to sub-agents, unaware that the task is already completed or that an agent has failed. This wastes time and resources without accomplishing anything [6]. Similarly, context contamination happens when multiple agents write to a shared state at the same time. One agent’s incomplete update can corrupt another’s data, leading to decisions based on faulty information [3][6]. In one case, parallel agents even made conflicting architectural decisions due to a lack of shared visibility [3].
Silent sub-agent failures are especially dangerous. An agent might report a task as "completed" while providing output that is syntactically correct but factually wrong – or even empty. These errors can cascade through the system, causing widespread issues [6][8]. In production environments, specification failures like these account for 42% of multi-agent errors, while coordination breakdowns contribute to 37% [3].
Other challenges include resource contention and context window exhaustion during long-running sessions, which can corrupt the state or truncate instructions, leading to gradual performance degradation [6][4].
To detect these issues, monitoring specific metrics is essential. Key indicators include:
waiting_runs: Tracks the number of agents stuck in a waiting state.wait_duration_p95: Measures how long agents remain blocked.blocked_transition_rate: Identifies recurring agent blockages.lease_conflict_rate: Monitors how often resource locks expire or overlap.
Spikes in these metrics often signal deadlocks or resource contention.
Addressing these problems requires proactive measures. Timeouts should be enforced on agent waits, and shared resource locks should have time-to-live (TTL) limits [5][7]. Strict JSON schemas can help eliminate communication errors between agents [9]. For agents working on the same code repository, using separate git worktrees prevents one agent’s branch checkout from interfering with another’s environment [4]. Additionally, implementing state checkpointing allows long-running pipelines to resume from their last successful step, avoiding the need to restart entirely [7].
Conflict Resolution Patterns
When agents produce conflicting outputs, a structured approach is necessary to determine the correct result. Here are some common resolution strategies:
- Majority voting: This involves running the same task through multiple agents – often using different models like GPT-4 and Claude 3 – and selecting the most frequent output [11][12]. While this reduces errors like hallucinations, it increases both latency and cost. It’s less effective if all agents share similar configurations [7][12].
- Hierarchical overrides: A supervisor agent resolves conflicts, striking a balance between automated speed and human reliability for critical decisions. For example, Anthropic‘s internal tests showed that a hierarchical setup – where one lead agent manages 3–5 subagents – performed 90.2% better on research tasks compared to a single agent [10]. However, this method depends heavily on the supervisor’s reasoning skills and requires clear escalation paths to avoid bottlenecks.
- Human escalation: Reserved for high-stakes or edge-case decisions, human involvement ensures maximum accuracy. For instance, approving a $50,000 refund could be escalated when agents fail to reach a consensus. A "min-agreement" threshold, like 0.6, can trigger escalation to either a human or a higher-tier model [7][10].
Each conflict resolution method comes with trade-offs, balancing accuracy, latency, and complexity:
| Resolution Pattern | Accuracy | Latency | Implementation Complexity |
|---|---|---|---|
| Majority Voting | High (reduces hallucinations) | High (requires parallel runs) | Medium |
| Hierarchical Overrides | Medium (dependent on supervisor) | Low | Low |
| Human Escalation | Very High | Very High | High |
| Quality Gates | High | Medium | Medium |
| Market-based Bidding | Medium | Medium | High |
Quality gates act as checkpoints, validating agent outputs before they move downstream, thus preventing cascading errors [10][7]. Meanwhile, market-based bidding allows agents to "bid" on tasks based on their confidence levels, directing work to the most capable agent. However, this method adds coordination overhead [10].
As Clarity points out:
"A multi-agent system is a distributed system with all the failure modes of distributed systems plus all the failure modes of LLMs." – Clarity [7]
To minimize risks, modeling agent dependencies as a Directed Acyclic Graph (DAG) can prevent circular dependencies that lead to deadlocks [14][15]. Circuit breakers can detect repeated failures or low-confidence outputs, triggering automatic escalation when needed [10][7]. Tracking each agent’s progress independently also allows the system to recover from the last checkpoint [13]. Finally, following the single-writer principle – ensuring only one agent can modify critical entities like orders or payments – helps avoid race conditions and data corruption [13].
Preventing Cascading Failures in Agent Pipelines
In multi-agent systems, one failure can quickly snowball into a much larger problem. When a single agent makes an error, it often affects the entire pipeline, corrupting data and triggering issues at every downstream step. For example, in a 10-step sequential pipeline, even with a 99% reliability per agent, the overall success rate drops to just 90.4%. If the reliability falls to 95% per step, the end-to-end success rate plummets to 59.9% [18].
Typical Pipeline Failure Scenarios
Failures in these systems can be broadly categorized into hard failures and soft failures:
- Hard failures are the obvious ones – exceptions, crashes, or timeouts that stop the system in its tracks.
- Soft failures, on the other hand, are much trickier. These happen when an agent produces output that looks valid (e.g., correct JSON format, passes schema checks) but contains incorrect or fabricated information. For instance, a study by Galileo AI in December 2025 revealed that one failing agent could compromise 87% of downstream decisions within just four hours [18].
Another sneaky issue is retry amplification, where uncoordinated retries multiply a single error into dozens of API calls – 27 in some cases [20]. This not only drains resources but can also breach rate limits.
In scatter-gather pipelines, incomplete data aggregation can occur when multiple agents work in parallel, and one of them fails. If the system continues with partial data, it risks making poor decisions. Lastly, cascading errors arise when downstream agents blindly trust upstream outputs. Acting on flawed data only magnifies the original mistake [6][18].
Understanding these failure patterns is crucial for designing systems that can isolate and recover from errors effectively.
Failure Isolation and Recovery Techniques
To prevent a single failure from snowballing across the pipeline, robust isolation and recovery mechanisms are essential. Here are some key strategies:
- Isolation through message passing: Instead of sharing mutable state directly between agents, use a coordination layer where agents communicate via structured messages. This prevents one failing agent from corrupting another’s state [17].
- Pipeline halt protocol: Implement a shared boolean flag that downstream agents check before executing. If an upstream agent fails or produces unverified output, it sets the halt signal. Critical steps like payment processing must honor this flag and stop immediately, while non-critical nodes (e.g., logging) can continue to capture failure details [18]. As Ranjan Kumar puts it:
"The most important design decision in a multi-agent pipeline is not how to make each agent more reliable in isolation. It is how to prevent a single agent’s failure from compounding into a pipeline-wide incident." – Ranjan Kumar [18]
- Semantic verification gates: These gates act as independent checks between agents to catch soft failures. A smaller, faster model can verify the factual accuracy of the data before it moves downstream, stopping hallucinations in their tracks [18].
- Checkpointing: Save the state at each stage of the pipeline. This way, if something goes wrong, the system can restart from the last valid step rather than starting over [17][18][19].
- Parallel pipeline management: Label agents as either "required" or "optional." If a required agent fails, the system halts; if an optional one fails, the pipeline continues with reduced functionality [18].
- Retry logic and idempotency keys: Use tiered retry mechanisms with idempotency keys to prevent duplicate actions during transient failures [16][17][20].
| Isolation Method | Speed | Cost | Best For |
|---|---|---|---|
| Circuit Breaker | Instant (Fail-fast) | Low | Protecting against flaky external APIs or outages [16][17] |
| Idempotent Retry | Medium | Moderate | Handling transient errors like network blips [16] |
| Fallback Agent | Fast | Variable | Keeping services running when primary models fail [16][7] |
| Checkpointing | Slow (Manual/Auto) | High | Resuming expensive workflows after a crash [17][18] |
| Semantic Gate | Medium | Moderate | Stopping soft failures from spreading [18] |
Finally, define a minimum viable output for each agent. This could be a fallback result using cached data or a static template. Even if the pipeline can’t deliver a full result, this ensures it can still provide partial functionality, keeping services operational during failures [17].
Tracing Causality Across Multiple Agents
When a multi-agent system goes off track, pinpointing what went wrong and why becomes a daunting task. Unlike traditional applications, where debugging follows predictable patterns, multi-agent systems involve layers of complexity. A single user request can trigger numerous LLM calls, tool executions, and autonomous sub-agent tasks – all of which influence the system’s downstream behavior. Unlike microservices, which stick to clear request-response cycles, agents make decisions autonomously, often leading to unpredictable outcomes [21][22].
Why Tracing is Hard in Multi-Agent Systems
The biggest issue? Standard infrastructure monitoring falls short. An agent might hallucinate, pick the wrong tool, or generate fake data – all while returning a 200 OK status. These "cognitive failures" won’t show up on uptime dashboards or latency charts. And when multiple agents operate simultaneously, their logs get interwoven, making it nearly impossible to trace the causal chain. Without shared identifiers to link related actions, debugging becomes a game of guesswork.
Sam Lambert, former VP of Engineering at GitHub, captured this perfectly:
"Debugging distributed systems taught me humility. Debugging multi-agent systems taught me that humility was wildly insufficient." [24]
The challenge isn’t just technical – it’s conceptual. Traditional application monitoring tools focus on request-response cycles, but agents require tracking decision chains. A single user action might ripple through multiple reasoning loops, state transitions, and handoffs. In fact, in 2024, 78% of engineering teams working on multi-agent systems identified debugging as their top operational challenge [24]. This underscores the urgent need for better observability.
Implementing Better Observability
To address these challenges, a solid observability framework is key. It starts with context propagation – ensuring a trace ID follows the execution path across every agent boundary. For example, by injecting traceparent headers into HTTP calls or embedding context in message queues, you can link all activities back to the original request [21][22][24]. Anthropic’s engineering team, for instance, cut their mean time to resolution (MTTR) for agent failures from 4.2 hours to just 22 minutes by adopting structured trace IDs for all agent interactions [24].
Effective observability covers five critical areas: orchestration, agent state, tool execution, data handoffs, and LLM decision-making patterns [24]. For workflows that run over extended periods, logs alone won’t suffice. Instead, replayable event streams – like those powered by Kafka – are essential for retracing state changes [23].
The industry is increasingly adopting OpenTelemetry (OTEL) as the standard for instrumentation. OTEL’s semantic conventions define attributes such as gen_ai.agent.id, agent.tool_calls, and agent.cost_usd [21][22]. When logging LLM calls, avoid storing complete prompt and response texts directly in span attributes, as this can balloon storage requirements. Instead, save the full text in a separate blob store (e.g., S3) and include a pointer in the trace [22][24].
| Tool | Integration Effort | Debugging Effectiveness | Best For |
|---|---|---|---|
| LangSmith | Low (if using LangChain) | High (Visual reasoning trees) | Teams already in the LangChain/LangGraph ecosystem [21] |
| Helicone | Very Low (Proxy-based) | Medium (LLM-call focused) | Quick cost tracking and latency monitoring without code changes [21][22] |
| Langfuse | Medium (SDK/OTEL) | High (Nested spans) | Open-source/self-hosted needs and complex nested agent trees [21][22] |
| AgentOps | Medium (SDK) | High (Session replay) | Agent-native concepts like "action" and "event" rather than just LLM calls [21] |
| Arize Phoenix | Medium (OTEL-native) | High (RAG/Eval focus) | Teams needing deep ML observability and embedding visualization [21][22] |
| Braintrust | Medium (SDK) | High (Eval-centric) | Teams prioritizing A/B testing and connecting evals to production traces [21] |
Improving observability not only helps trace decision chains but also makes it easier to isolate errors in real time, preventing cascading failures.
To further enhance system reliability, implement schema validation at every handoff. Tools like Pydantic can catch silent failures where data might be structurally correct but semantically flawed [24]. Additionally, use circuit breakers for tool calls to prevent a single slow API from causing timeouts across the entire pipeline [24]. The ultimate goal is to understand not just what happened but why those decisions were made [22].
Managing Context Across Agent Boundaries
Shifting from demo setups to production environments comes with its own set of challenges, especially when it comes to maintaining context. In multi-agent systems, the smooth transfer of context during handoffs is often more complicated than expected. What starts as a clear user request can become muddled as it moves between agents. In fact, 73% of multi-agent systems fail due to context loss [26]. The main culprits? Issues like token bloat, state drift, context poisoning, and even security risks.
Context Propagation Problems
Token bloat happens when every agent receives the complete context, leading to a "context explosion." This means each handoff duplicates unnecessary history, rapidly filling up the available memory window with irrelevant data. Systems with isolated contexts can use up to 15 times more tokens compared to single-agent workflows [30]. As context size grows, costs increase, and when memory usage exceeds 70%, models often resort to automatic compression – resulting in a loss of reasoning clarity [4].
Another challenge is state drift, where the original instructions lose their clarity over time. Long-running agents accumulate so much history that the initial task gets diluted – a phenomenon sometimes called "context rot" [27][28]. This is similar to the "telephone game", where subtle nuances are lost as information is passed along. As Eric Gerl, an infrastructure engineer, explains:
"Stale context is worse than no context, because missing context produces a question, while stale context produces a confident wrong answer" [28].
Context poisoning is another major issue. Errors made by one agent – whether due to hallucinations or incorrect assumptions – can cascade through the system. Later agents treat this flawed context as accurate, allowing the problem to silently propagate. On top of this, shared configurations can introduce security risks. For example, an agent might mistakenly assume an incorrect role, such as a builder agent trying to assign tasks it shouldn’t handle [4].
These problems make it clear that smarter context-handling strategies are necessary. Let’s look at some of the techniques that can help.
Context Propagation Approaches
Addressing these challenges requires more intelligent methods of managing context [26]. One effective approach is observation masking, where verbose outputs from tools are replaced with placeholder tokens. This method preserves reasoning while saving space. Benchmarks like SWE-bench-Verified show that observation masking can reduce costs by over 50% [27]. However, using techniques like LLM summarization can slightly increase overall execution time (by 13% to 15%) due to the added processing required [27].
For workflows that demand a complete audit trail, event sourcing offers a reliable solution. Instead of passing data directly through parameters, agents query a permanent log of events. This treats context as an ambient state that agents can access as needed [29]. Cauri Jaye, an engineer specializing in multi-agent systems, describes it like this:
"The fundamental mismatch: you’re treating context as data to push through a pipeline, when it should function as ambient state that any participant can query" [29].
Event sourcing also improves security by allowing agents to reference sensitive data through pointers rather than embedding it directly in prompts.
| Method | Token Efficiency | Information Fidelity | Best Use Case |
|---|---|---|---|
| Full Context Passing | Low | High | Short, critical linear chains |
| Summarization | Moderate | Moderate/Low | General history preservation |
| Observation Masking | High | High | Technical tasks (coding, logs) |
| Event Sourcing | High | High | Multi-tenant/complex workflows |
Another helpful strategy is task re-anchoring, which involves periodically reintroducing the core objective at the top of the context window to combat drift [28]. For longer sessions, maintaining a "shadow journal" in a persistent store can capture key actions [4]. This ensures every agent works with an accurate and authoritative source of truth, rather than a degraded version of the original context.
Controlling Costs When Every Agent Calls an LLM
Once context propagation challenges are handled, the next big issue is managing costs. Multi-agent systems don’t just use more tokens – they multiply them in ways that can catch teams off guard. A single request that might cost just pennies can quickly balloon to dollar-level expenses when agents start coordinating, retrying, and sharing context back and forth.
What Drives Costs in Multi-Agent Systems
The main culprit here is token amplification, but that’s just the starting point. The real cost surge happens because of how LLM APIs charge. Many providers re-bill the entire conversation history on every call, causing costs to grow at a quadratic rate (O(N²)) in iterative workflows. While multi-agent setups typically consume 4–5× more tokens than single-model systems, a 20-step agent workflow can use over 10× the tokens you might initially estimate [31][35].
Costs are further inflated by coordination overhead and workflow design. Here’s how token consumption adds up:
- Planning steps: 200–500 tokens per step
- Inter-agent handoffs: 300–600 tokens each
- Output validation: 100–250 tokens per check [31]
When these steps are chained together – like router → sub-agent → tool calls → verifier – each hop increases both the number of calls and the size of the context [34]. As PracticalSystems puts it:
"Cost doesn’t grow linearly with traffic. It grows with orchestration." [34]
Take the example of Iterathon’s engineering team in 2026. Their multi-agent customer service system handled 2.9 million queries per month but ended up costing $47,000 monthly – double their projected $22,700 for a single-agent setup. The multi-agent design caused a 4.3× token amplification and added 4.5 seconds of latency, all for just a 2.1% accuracy improvement (94.3% vs. 92.2%). After reverting to a single-agent system, they saved $296,400 annually [33].
Another danger is recursive loops. Agents can get stuck in "context rot", endlessly re-planning or retrying tools. This can drive costs up by as much as 10× before circuit breakers step in to stop the spending [32][34]. Majid Sheikh, CTO at Agents Arcade, cautions:
"If you budget per request, you will miss the real number. You must model per workflow and per decision loop." [32]
To tackle these escalating costs, specific strategies are necessary.
Cost Control Techniques
Model tiering is one effective approach. By using smaller, cheaper models for simpler tasks like routing and planning, and saving high-parameter models for more complex synthesis, teams can cut inference costs significantly [32][2]. For example, lightweight models like GPT-4o-mini cost $0.15 per 1M input tokens compared to $2.50 for GPT-4o – a 16× cost difference [38][39].
Prompt caching is another powerful method. Tools like Redis or provider-native caching options can reduce token costs by up to 90% while also cutting latency by as much as 85% [34][36]. Around 31% of LLM queries in typical workloads show semantic similarity, meaning a large portion of calls could be avoided with caching [36].
Context trimming helps prevent unnecessary token usage. By instructing agents to summarize or prune context every 10–15 tool calls, teams can lower token expenses by up to 22.7% [35]. Studies reveal that 39.9% to 59.7% of tokens in some agent workflows are redundant and don’t improve performance [35].
Hard budget guards are essential for keeping runaway costs in check. This includes setting limits on decision loops (e.g., max 6 hops) and capping per-request costs (e.g., $0.50). These circuit breakers stop workflows before they spiral out of control [32][39].
| Cost-Saving Method | Avg. Cost Reduction | Scalability Impact |
|---|---|---|
| Model Tiering | 20–30% [32] | High; reduces per-call costs |
| Prompt Caching | Up to 90% [34] | High; ideal for repeat traffic |
| Context Trimming | ~22% [35] | Moderate; avoids "context rot" |
| Shared State | Variable | High; reduces coordination bloat |
Ultimately, the focus should be on cost per successful task completion, not just cost per token. A cheaper model with a 20% failure rate can end up costing 4.6× more than a pricier model with a 2% failure rate when retries and human escalations are factored in [37].
Conclusion: Building Multi-Agent Systems for Production
After diving into topics like coordination, observability, context management, and cost control, one thing becomes clear – moving multi-agent systems from demo to production is no small feat. While these systems often shine in controlled demonstrations, the challenges of real-world deployment are far more complex. Issues like coordination conflicts, cascading failures, gaps in observability, context propagation troubles, and rising costs tend to dominate the production landscape.
The numbers paint a sobering picture. Studies show that nearly 40% of multi-agent pilots fail within six months, and only about 25% of organizations successfully scale their agent-based AI initiatives [25][41][3]. Gartner also forecasts that by 2027, over 40% of such projects will be scrapped due to cost overruns and coordination hurdles [10].
From a cost perspective, the trade-offs are stark. Multi-agent systems may offer slight accuracy improvements – around 2.1% on average – but at the expense of nearly doubling operational costs [25][10].
Achieving success with multi-agent systems requires more than just tweaking prompts or simple adjustments. It demands a disciplined engineering approach. Key strategies include:
- Prioritizing observability to monitor system behavior effectively.
- Establishing strict API contracts to ensure smooth inter-agent communication.
- Setting hard limits on loops and budgets to prevent runaway processes.
- Centralizing orchestration for managing critical data and workflows [8][1][40].
As Xgrid aptly put it:
"The boundary between workflow and activity code must be drawn at the determinism line, not the convenience line" [40].
FAQs
When should I avoid a multi-agent design?
When deciding on system architecture, it’s wise to avoid a multi-agent design if the downsides surpass the advantages of modularity and parallel processing. For instance, steer clear of this approach if cascade failures are difficult to control, resource contention becomes a recurring issue, or handoff errors are challenging to manage. Another red flag is when the combined failure probabilities of multiple agents make the system unreliable.
Lastly, if the effort required for orchestration outweighs the benefits of using multiple agents, a simpler, more streamlined architecture might be a better choice for maintaining reliability and ease of operation.
What’s the minimum observability setup to debug agent chains?
To get started, you need a minimum setup that includes structured tracing for all agent interactions. This means capturing trace IDs at every step, logging decisions, tracking tool usage, and recording data handoffs. All these logs should be centralized in a real-time dashboard for easy monitoring.
Why is this important? Traditional LLM observability just doesn’t cut it for multi-agent systems. These systems demand detailed tracking of decisions and interactions to help you diagnose failures, trace their root causes, and stop errors from snowballing into bigger problems. A dashboard with trace visualization becomes your go-to tool for spotting and fixing issues quickly.
How do I cap token spend per workflow without breaking reliability?
To manage token usage effectively without sacrificing reliability, focus on modeling costs at the workflow level. This means considering the total internal calls and the size of the context being processed. Here are some practical strategies you can use:
- Limit context size: Keep the context manageable to reduce token consumption.
- Summarize or prune periodically: Regularly condense or trim the context to maintain efficiency.
- Avoid unnecessary retries: Prevent redundant processing that wastes tokens.
Additionally, set up orchestration rules to handle backpressure, manage retries, and enforce token budgets. When usage approaches established limits, trigger fallback mechanisms or pause processing altogether to ensure the workflow remains stable and uninterrupted.
Related Blog Posts
- LangGraph vs CrewAI vs AutoGen: How We Evaluated All Three Before Recommending One for a Production Deployment
- The Evaluation Framework We Use When a Client Asks Us Which Agent Stack to Build On
- Tool Calling Reliability Across Agent Frameworks: What We Measured and What It Means for Your Architecture
- How to Stress Test an Agent Framework Before You’re Too Deep to Switch
Huzefa Motiwala
Huzefa Motiwala is a co-founder of AlterSquare, an application-layer partner that helps SaaS and tech-led companies stabilise, modernise, and extend complex systems without breaking what already works. He comes at software from design and frontend, with a focus on data-heavy interfaces and on getting real teams to actually adopt what gets built — not just ship it. He writes about working in fragile, high-stakes codebases: incremental change over risky rewrites, UX and technical debt, and embedding AI into real workflows.


Leave a Reply