

When your app is small, it feels fast because of its simplicity – minimal JavaScript, lightweight CSS, and fewer network requests. But as the app grows, hidden performance issues emerge, slowing it down. Here’s what happens as your app scales:
- Core Web Vitals are harder to maintain: Metrics like Largest Contentful Paint (LCP), Interaction to Next Paint (INP), and Cumulative Layout Shift (CLS) often degrade as bundles grow and rendering becomes more complex.
- Rendering inefficiencies multiply: Inline functions, overused Context APIs, and unoptimized list rendering lead to unnecessary re-renders and wasted resources.
- Assets balloon: JavaScript bundles, images, and unused dependencies make pages heavier, increasing load times.
- State management struggles: Non-memoized selectors, global state misuse, and sequential data fetching create bottlenecks that hurt responsiveness.
To prevent these issues, prioritize scalable architecture from the start. Use tools like React Profiler, Webpack Bundle Analyzer, and Lighthouse to measure performance. Adopt strategies like code splitting, virtualization for large lists, efficient state management, and modern image formats to keep your app fast as it grows.
Key takeaway: Small apps feel fast, but scaling requires proactive performance strategies to avoid bottlenecks that frustrate users.
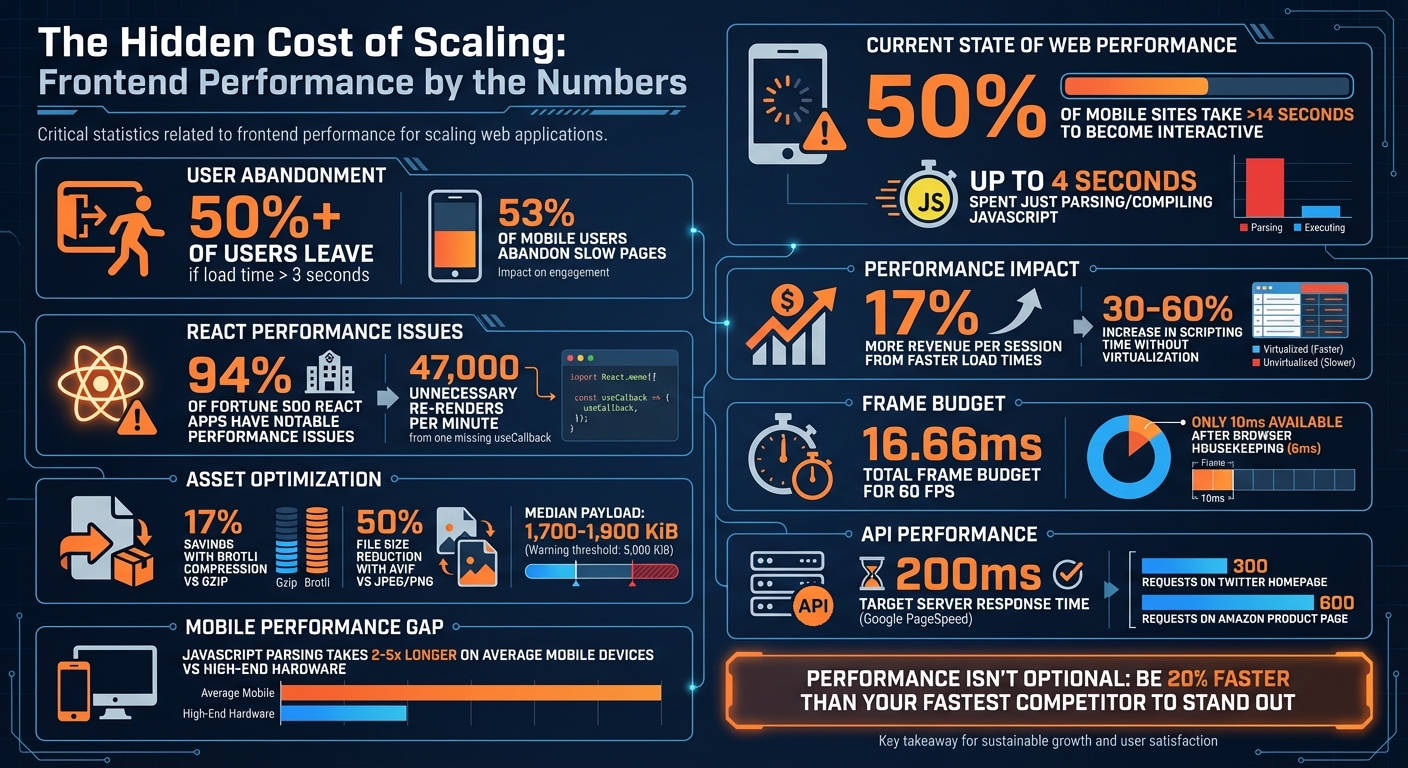
Frontend Performance Statistics: Impact of Scaling on Web Applications
Rendering and Component Architecture Problems
Rendering Mistakes in Small Apps
The way your app handles rendering in its early stages can become a major headache as it grows. A common issue is unstable prop references. For instance, using inline functions like onClick={() => handleClick()} or inline objects such as style={{margin: 10}} creates new memory references each time the component renders. This behavior forces memoized child components to re-render unnecessarily, which can quickly snowball into performance problems [8][10].
Another common pitfall is the overuse of the Context API. Relying on a single global Context for rapidly changing data – like user inputs or notifications – causes every component consuming that Context to re-render, even if they only need a small, static portion of the state [10]. In deeply nested component trees, this ripple effect can cascade through the entire structure [8][9]. To put it into perspective, 94% of React applications reviewed in Fortune 500 companies had notable performance issues, with one case showing a single missing useCallback hook triggering 47,000 unnecessary re-renders every minute in production environments [7].
List rendering is another area where developers often cut corners. Failing to use virtualization for large lists means rendering hundreds or even thousands of DOM nodes, which adds significant layout and paint overhead. This oversight can lead to a 30–60% increase in scripting time, particularly in apps with deep component hierarchies [10].
How to Build Scalable Rendering
To avoid these bottlenecks, start by co-locating state with the components that consume it. Use hooks like useMemo and useCallback to stabilize prop references and cut down on unnecessary re-renders [9][11][8][10]. For large lists, virtualization is key. Libraries such as react-window or vue-virtual-scroller can handle lists with more than 50–100 items by rendering only the visible elements, significantly reducing DOM overhead [5][10].
Breaking down large global contexts into smaller, more focused providers – like UserContext, ThemeContext, and NotificationContext – can also help limit the scope of updates [10]. If you’re working with Vue and managing large, immutable datasets, consider using shallowRef or shallowReactive to avoid the overhead of deep proxies [1]. Additionally, take advantage of concurrent features like useTransition to mark slower updates as less urgent, ensuring your UI remains responsive during critical interactions like typing [10][9].
Tools for Finding Rendering Problems
When it comes to diagnosing rendering issues, React Profiler and Vue DevTools should be your go-to tools. They allow you to measure the "cost" of individual renders and pinpoint components that are re-rendering unnecessarily [1][12]. Chrome DevTools also offers valuable insights through its Performance panel and Rendering tab. Features like "Paint Flashing", which highlights repaints in green, and "Layout Shift Regions", which show up in purple, make it easier to identify problem areas [13][15].
For debugging during development, tools like why-did-you-render can log unnecessary re-renders directly to your console, while React Scan identifies performance issues and flags components for optimization [10][9]. Always remember to benchmark using production builds. React’s development mode, while helpful for debugging, adds extra warnings and makes the library slower [5]. Additionally, Chrome’s Coverage Panel can help you identify unused JavaScript, which can then be removed or deferred to shrink your bundle size [6].
"If you didn’t measure it, don’t optimize it." – Growin [10]
To maintain smooth animations at 60 FPS, you have a tight frame budget of just 16.66 milliseconds. After accounting for browser housekeeping (around 6 milliseconds), your app has only 10 milliseconds to execute its tasks [14]. By using these tools and strategies, you can identify and address rendering issues early, ensuring your app performs efficiently as it scales. This foundation will also prepare you to tackle other challenges, like managing asset bloat.
Asset Bloat and Payload Problems
How Bundles and Assets Grow Out of Control
After tackling rendering challenges, the next big hurdle in scaling performance is managing asset bloat. What starts as a small JavaScript bundle can balloon quickly. Every npm package you add often imports entire libraries, even if you’re only using a tiny piece of them. On top of that, old or abandoned packages can quietly linger in your codebase, adding unnecessary weight [17][1].
Server-Side Rendering (SSR) in modern frameworks can also complicate things. With SSR, the application’s state is serialized into the HTML as JSON, effectively doubling the payload size and increasing parsing demands [6]. Without code splitting, you’re loading the entire application upfront – including routes and features users might never even visit [16].
The consequences are serious. Parsing and executing JavaScript is far more demanding than processing images or fonts. On average mobile devices, parsing JavaScript takes 2–5 times longer than on high-end hardware [18]. This delay can create an "uncanny valley" effect where the page looks ready but doesn’t respond to user interactions, which directly impacts your Interaction to Next Paint (INP) scores [18][6].
"Byte-for-byte, JavaScript is more expensive for the browser to process than the equivalently sized image or Web Font." – Tom Dale [18]
The stats paint a clear picture: over 50% of users will leave a site if it takes more than 3 seconds to load [16]. Yet, 50% of mobile sites take over 14 seconds to become interactive, with up to 4 seconds spent just parsing and compiling JavaScript [18]. The median network payload for websites ranges between 1,700 and 1,900 KiB, but Lighthouse flags pages as having "enormous payloads" when total network requests exceed 5,000 KiB [19]. It’s clear that optimizing asset delivery isn’t just helpful – it’s essential.
How to Optimize Asset Delivery
One of the most effective ways to tackle asset bloat is code splitting. By using dynamic imports, you can break your JavaScript bundle into smaller, more manageable pieces, loading only what’s necessary for the user’s initial route [16][1].
Compression also plays a big role. Brotli compression, for example, outperforms Gzip, offering significant size reductions. CertSimple reported around 17% savings on compressed JavaScript, and LinkedIn shaved 4% off its load times by switching to Brotli [18]. Tools like Terser or UglifyJS can further shrink your code by removing unnecessary characters and whitespace [18].
For images, modern formats like WebP and AVIF are game-changers. AVIF, in particular, can reduce file sizes by up to 50% compared to JPEG or PNG while maintaining similar quality [24]. Set JPEG compression levels to 85 to strike a balance between quality and size. Use the srcset attribute to serve images optimized for different screen resolutions, and add loading="lazy" to defer loading images that aren’t immediately visible [19][22].
Another key strategy is using resource hints. For example, rel=preconnect warms up connections to critical third-party origins, like your CDN, early in the loading process [22]. Use the defer attribute to prevent scripts from blocking HTML parsing. Additionally, prioritize resources wisely: use fetchpriority="high" for hero images and fetchpriority="low" for less critical scripts [22].
Measuring Asset Performance
To keep asset bloat in check, leverage tools like Lighthouse, WebPageTest, and PageSpeed Insights. These tools can audit your site’s byte weight and flag render-blocking resources [19][20]. For a smooth experience on a 3G connection, aim to keep your total byte size under 1,600 KiB to achieve a Time to Interactive (TTI) of 10 seconds [19]. Use tools like size-limit to enforce this performance budget and fail builds that exceed it [23][21].
Tools like Webpack Bundle Analyzer and Source Map Explorer are invaluable for identifying bloated dependencies. They help you pinpoint heavy libraries that could be replaced or removed [21]. The Chrome DevTools Coverage tab is another great resource, showing unused JavaScript that can be optimized or deferred [17][21]. Regularly auditing your code with these tools helps prevent performance from degrading over time.
State Management and Data Fetching Problems
Common State Management Mistakes in MVPs
State management issues can seriously impact performance as applications grow. While smaller apps might get by with less efficient patterns, these often fail when scaling up. A prime example is using non-memoized selectors. For instance, calling methods like .filter() or .map() directly within Redux’s useSelector can create new array references, leading to unnecessary re-renders. React-Redux even warns about this: "Selector unknown returned a different result when called with the same parameters. This can lead to unnecessary rerenders" [25].
Another common misstep is putting everything into a global state. While this might seem like a quick fix for small apps, it can cause cascading updates across the entire UI as the app grows [9]. Similarly, nested data structures, which might work fine with a few records, become a performance bottleneck when updating deeply nested items in larger datasets [25].
Sequential data fetching is another trap that can slow down large applications. While the delay might go unnoticed in smaller apps, it becomes a real issue in larger ones. For example, a Twitter home page might trigger around 300 requests, while an Amazon product page could send as many as 600 [27]. Without proper caching, duplicate requests can pile up and waste resources [26][9].
These challenges highlight the importance of adopting scalable state management strategies, which we’ll explore next.
Building Scalable State and Data Systems
To avoid these pitfalls, it’s essential to implement scalable solutions for managing state and data. Start by separating server and UI state using tools like TanStack Query or SWR. For Redux, rely on createSelector to ensure selectors only recalculate when the state changes [25]. Normalize your data structures with createEntityAdapter, parallelize data fetching using Promise.all(), and manage high-frequency updates with throttling or debouncing techniques [9][25][26].
By optimizing your state management, you can also address data loading issues more effectively.
Finding and Fixing Data Bottlenecks
To identify and resolve data bottlenecks, tools like Chrome DevTools are invaluable. Use the Network panel to spot sequential or duplicate requests. Meanwhile, the Performance panel can help pinpoint "long tasks" – JavaScript operations that lock up the main thread for 50 milliseconds or more, making your interface unresponsive [6]. These bottlenecks directly affect metrics like Time to Interactive (TTI) and Interaction to Next Paint (INP), as discussed earlier. Recording a CPU profile during interactions can further reveal where time is being wasted in data processing [6][28].
According to Google’s PageSpeed Insights, server response times should ideally stay under 200 milliseconds [2]. If your APIs consistently exceed this limit, it’s worth revisiting your architecture. Additionally, the Coverage tab in DevTools can highlight unused JavaScript, opening up opportunities for code splitting and performance gains [27][1].
sbb-itb-51b9a02
Building Performance into Your Development Process
Why Startups Ignore Performance
Startups often put performance on the back burner in favor of rolling out features quickly. Developers typically work on high-end machines with blazing-fast internet, which means they rarely experience the sluggish performance users face on $200 Android devices over 3G networks [28][29]. This gap in environments hides performance bottlenecks until they start impacting users in production.
Without a company-wide commitment to speed, performance issues become technical debt that only grows over time [31][4]. Development setups often lack the third-party analytics scripts, ad trackers, and content delivery network (CDN) overhead that slow down production environments [29][2]. By the time these problems surface, the damage is already done – users who experience faster load times generate 17% more revenue per session than the average user [4]. This highlights the importance of setting clear performance goals early on.
Setting Performance Budgets and Limits
To avoid scaling issues, establish strict performance budgets. These budgets act as hard limits to prevent performance regressions before they affect users. As Milica Mihajlija explains:
"Good performance is rarely a side effect. As with most other things – to reach a goal you have to define it clearly" [31].
Performance budgets should cover three key areas:
- Quantity-based limits: Set caps on things like bundle sizes, image weights, and the number of HTTP requests.
- Milestone timings: Aim for metrics like First Contentful Paint under 2.5 seconds and Time to Interactive under 5 seconds on a 3G connection.
- Rule-based scores: For example, target a Lighthouse performance score of at least 85/100 [31][33].
To enforce these budgets, use a two-tier system in your CI/CD pipeline. "Warning" thresholds help flag potential issues early, while "Error" thresholds block deployments that would noticeably degrade performance [29][32]. To stand out, aim to be at least 20% faster than your fastest competitor [33][4].
Tools and Processes for Maintaining Performance
Automating performance checks is key to making speed a priority. Tools like Lighthouse CI and bundlesize can be integrated into your pull request workflow – if a test fails, the build should fail too [30]. Enable Webpack performance hints in your configuration to get immediate warnings in the CLI when assets exceed your set limits [30]. For ongoing monitoring, combine synthetic testing (using Lighthouse for controlled lab conditions) with real-user monitoring tools like Sentry to understand how your site performs for visitors on various devices and networks [3][34].
During development, simulate real-world conditions by throttling your connection to "Fast 3G" and applying a 20× CPU slowdown using Chrome DevTools [28]. For data-heavy interfaces, use virtualization libraries to render only the visible items in a list, reducing DOM overhead significantly [1]. By automating performance checks and integrating them into your workflow, you ensure that speed becomes a core requirement rather than an afterthought. Starting these practices early can save you from major headaches as your app grows.
Frontend System Design: The 2025 Web Performance Roadmap
Conclusion: Scaling Frontend Performance with AlterSquare

As applications grow, small issues like hydration bloat, main thread blocking, and asset delivery delays can snowball into major business challenges. These problems can cost you up to 53% of mobile users who expect pages to load in under three seconds [35].
To address these challenges, it’s time to rethink your architecture. Moving away from monolithic client-side SPAs to approaches like Islands Architecture or Server-Side Rendering can bridge the gap between visual load and actual interactivity [6]. Techniques like code-splitting, breaking up long-running tasks, and optimizing the critical rendering path can help keep your Core Web Vitals in check [6][35].
AlterSquare specializes in helping teams tackle these challenges head-on. With scalable engineering solutions, we identify rendering bottlenecks, implement list virtualization, and convert assets into next-gen formats – cutting file sizes by over 30% [35]. By integrating performance budgets into your CI/CD pipeline, we ensure regressions are caught early, long before they impact production. This proactive, performance-first mindset is essential for scaling your app effectively.
Whether you’re stabilizing a legacy codebase or gearing up your MVP for growth, AlterSquare provides the expertise to maintain speed as user demand increases. Our phased delivery framework ensures you’re not just solving immediate issues but building a foundation for sustained performance as your application evolves.
Performance isn’t just a feature – it’s part of the infrastructure. With AlterSquare, you’ll have the strategy and execution needed to scale with confidence.
FAQs
How can I avoid rendering issues as my app grows?
To ensure your app runs smoothly as it scales, prioritize maintaining a lightweight DOM and steer clear of overly intricate layouts. Complex designs can lead to layout thrashing, which slows down rendering and impacts performance. Focus on optimizing the critical rendering path by cutting down on unnecessary DOM nodes, removing unused CSS, and simplifying layout calculations.
It’s also a good idea to routinely check your app’s performance using tools like Lighthouse or similar testing platforms. These tools can pinpoint performance bottlenecks and provide actionable insights, helping you make precise adjustments to keep your app fast and responsive as it grows.
What are the best tools to identify and resolve asset bloat in my app?
To tackle asset bloat in your application, tools like Lighthouse (available in Chrome DevTools) and Google PageSpeed Insights can be incredibly helpful. These tools evaluate your app’s performance and identify oversized or unnecessary assets that might be dragging down its speed.
Leveraging the data from these tools allows you to streamline your app’s load times, cut down on bandwidth usage, and deliver a smoother experience for users – even as your application expands. Conducting regular asset audits is key to maintaining scalability and avoiding performance hiccups.
How can I manage state effectively to avoid performance issues in larger apps?
To keep your application running smoothly as it grows, it’s essential to manage state effectively in larger projects. Start by organizing your state into logical domains. Keep local state confined to individual components, while moving shared or frequently accessed data to a centralized store. Structuring your state with a normalized format can also help. This approach avoids deeply nested updates, making it simpler to modify specific entities without impacting unrelated parts of your app.
Breaking your state into smaller, independent slices or modules is another smart move. This way, updates only affect the relevant parts of the store. Use memoized selectors to derive data efficiently, ensuring that resource-heavy calculations only run when necessary. To reduce unnecessary re-renders, connect components directly to the specific data they need. For larger features or sections that aren’t used often, lazy-loading their state can help keep your app’s initial load time quick.
Don’t forget to routinely monitor your app’s performance. Tools like dev-tools and performance audits can help you spot and fix inefficiencies. By following these practices, you can ensure your frontend remains scalable and responsive as your application continues to grow.


Leave a Reply