
AI Prompts for Frontend Engineers: 9 Copy-Paste Prompts for the Work That Kills Your Afternoon
Taher Pardawala June 3, 2026
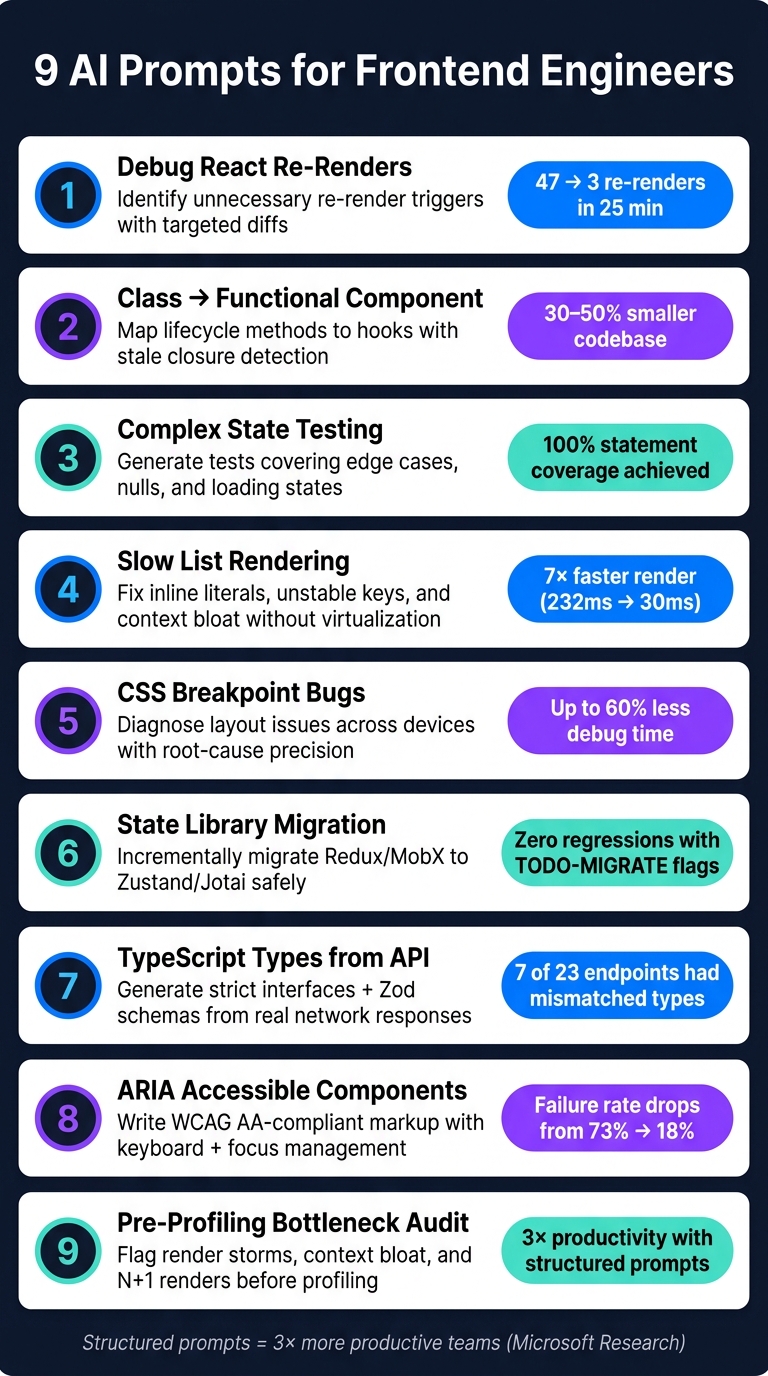
When tackling frontend tasks, the right prompts can save hours of debugging, rewriting, and refining. This article presents 9 tailored AI prompts designed for common challenges like fixing React re-render bugs, converting class components to functional ones, writing comprehensive tests, and improving accessibility. Each prompt provides a plug-and-play structure to get accurate, actionable results, helping you ship faster with fewer errors.
Key Highlights:
- React Debugging: Identify and fix unnecessary re-renders with targeted diffs.
- Class to Functional Conversion: Map lifecycle methods to hooks with clear explanations.
- Test Writing: Generate robust test cases covering edge cases and user interactions.
- Performance Optimization: Spot bottlenecks like context bloat, inline literals, and unoptimized event handlers.
- TypeScript Types: Generate precise types from API responses with edge case handling.
- Accessibility: Write ARIA-compliant, keyboard-friendly components with focus management.
These prompts are structured to address specific tasks, ensuring precise outputs while reducing the need for manual fixes. By using detailed input (like code snippets, symptoms, or logs), you can maximize AI efficiency and streamline your workflow.
Pro Tip: Save these prompts in a shared library for quick access and adapt them to your tech stack for even better results.
9 AI Prompts for Frontend Engineers: What Each Prompt Solves
How to Write Better AI Prompts as a Software Developer in 2026
sbb-itb-51b9a02
1. Debugging a React Component with Unexpected Re-Renders
Unexpected re-renders can be a real headache in React, often leading to performance problems. These issues typically stem from four main causes: a parent component re-rendering and pulling its children along, changes in context values, unstable object or function references failing shallow comparisons, or a hook dependency that updates on every render. The tricky part? Non-memoized components re-render every time their parent does, even if their props haven’t changed. This is often referred to as the "props myth", and it trips up many developers [3][4].
AI tools can make debugging these issues much faster. For example, in May 2026, developer Ryan Patel used Claude Code to debug a Next.js dashboard. The problem? 47 components were re-rendering with every keystroke in a search input. By describing the issue with specific details, the AI traced the problem to a bloated DashboardContext provider. The solution was to split it into two more focused providers: SearchProvider and SelectionProvider. This reduced the number of re-renders from 47 to just 3, and the entire diagnosis took only 25 minutes – far less than the 4 hours it would have taken manually [5].
The key takeaway here is to provide exact data when describing symptoms. For instance, saying "47 components re-render on keystroke" gives the AI a clear starting point, while vague descriptions like "my app feels slow" are much harder to work with.
"LLMs struggle with implicit runtime behavior. why-did-you-render turns runtime behavior into explicit text. Once behavior is textual: Debugging becomes a reasoning problem – which LLMs are good at." – Ravgeet Dhillon, Software Engineer, CloudAnswers [6]
📋 Copy-Paste Prompt
Here’s a ready-to-use prompt for debugging React performance issues:
You are a senior React performance engineer. Component name: [COMPONENT_NAME] Framework/version: [e.g., React 18, Next.js 14] Symptom: [DESCRIBE EXACTLY - e.g., "re-renders 12 times on a single keystroke in the search input"] Here is the component code: [PASTE COMPONENT CODE] Here are the why-did-you-render or React Profiler logs (if available): [PASTE LOGS OR WRITE "none"] Do the following: 1. Identify every unnecessary re-render trigger in this component. 2. For each one, state: (a) the component name, (b) what triggers it, (c) why it is unnecessary, (d) the specific fix, and (e) the expected reduction in render count. 3. Flag any unstable object, array, or function references being passed as props. 4. Do not rewrite the entire component - output only the targeted diffs needed to fix each issue. Why This Prompt Works
This prompt is designed to get precise, actionable feedback. By asking for "targeted diffs" instead of a full component rewrite, you get changes that are easy to review and merge. Including specific symptoms with numbers helps the AI focus on your unique render chain rather than offering generic advice. To maximize the AI’s effectiveness, paste your component code and, if possible, include logs from tools like why-did-you-render – this additional context sharpens the results.
2. Converting a Class Component to a Functional Component with Hooks
These days, many React projects are moving from class components to functional components. While class components still work, functional components paired with hooks offer more flexibility and simplicity. However, the transition isn’t always smooth. It’s easy to overlook lifecycle method equivalents, run into stale closures, or mismanage state updates. Done correctly, though, a converted component can shrink its codebase by 30–50% [7]. This section walks you through how to make the switch while preserving important behaviors.
One of the trickiest parts of the conversion is handling useEffect dependency arrays. When replacing componentDidUpdate, you must include all relevant props and state variables as dependencies. If you don’t, you risk stale values sneaking into your logic [8]. Another key difference is how useState works compared to this.setState. Unlike the latter, useState doesn’t merge objects automatically. You’ll need to either break your state into smaller pieces with multiple useState calls or opt for useReducer to manage more complex state updates [9].
"Unlike this.setState, the setter returned by useState does not merge objects. Each setter replaces the entire value for that variable." – DigitalOcean [9]
To approach this safely, consider a staged migration. Start by wrapping the class component and gradually moving logic into hooks. Pass data as props during the transition and leave the render method for last. One important note: don’t touch Error Boundaries. Since componentDidCatch and getDerivedStateFromError don’t have hook equivalents, these pieces must stay as class components [8][9].
📋 Copy-Paste Prompt
You are a senior React engineer specializing in modernizing legacy codebases. Component name: [COMPONENT_NAME] React version: [e.g., React 18.3] State management (Redux, Context, or external subscriptions) [YES/NO – if yes, specify] Here is the class component code: [PASTE CLASS COMPONENT CODE] Do the following: 1. Convert this class component to a functional component using hooks. 2. Map each lifecycle method to its hook equivalent and explain the pairing. 3. Identify state fields that should switch from useState to useReducer and explain the reasoning. 4. Identify any stale closure risks in the converted useEffect calls and show how to fix them. 5. Wrap callbacks passed to child components in useCallback to ensure referential stability. 6. Do NOT convert any Error Boundary logic - flag it and leave it as-is. 7. Output the full converted component followed by a short summary of every change made. Why This Prompt Works
This prompt ensures a thorough and accurate conversion by requiring explanations for every lifecycle-to-hook pairing. It also directly addresses common pitfalls, like stale closures in useEffect and when to use useReducer instead of useState. Mentioning state management tools like Redux or Context upfront prevents missteps in how state is handled. By focusing on these details, the prompt sets up a smooth and reliable migration process.
3. Writing Tests for a Component with Complex State
When working with components that have intricate state management, thorough testing is critical to ensure they function as intended. However, testing such components can be tricky, especially when mocks and simulations don’t behave as expected.
If you’re vague in your instructions – like simply saying, "write tests for this component" – you’ll likely end up with generic tests that only cover the "happy path." These tests often miss crucial edge cases, such as handling empty arrays, null returns, loading states, or error scenarios. By default, AI tools tend to focus on optimistic cases unless explicitly directed otherwise. To catch these edge cases, aim for at least 80% line coverage and 75% branch coverage – this is where many hidden bugs tend to lurk.
A great example of this was demonstrated by Lou Mauget from Keyhole Software in May 2026. He worked with a SimpleCompass React 19 component that involved SVG coordinate math, drag-to-angle repositioning, and double-click resets. By sharing the full component source and instructing the AI to simulate getBoundingClientRect (a function that jsdom doesn’t compute), Mauget was able to generate a Vitest suite with 100% statement coverage. The tests correctly simulated MouseEvent coordinates, showing how crucial detailed prompts are when working with AI. This specificity ensures the results are not just functional but also seamlessly integrate into your workflow.
One practical tip: introduce a small code mutation, like flipping a boolean or removing a null check, and rerun your tests. If no test fails, it’s a sign your tests aren’t catching real issues.
"The fastest way to inherit technical debt from AI tooling is to accept generated tests without verifying they catch real failures. One quick mutation check takes sixty seconds and tells you more about test quality than reading the assertion code." – Dennis Traina, AI automation services by 137Foundry [10]
📋 Copy-Paste Prompt
You are a senior frontend engineer writing tests for a React component. Component name: [COMPONENT_NAME] Testing framework: [e.g., Vitest 2.x / Jest 29.x] Interaction library: [@testing-library/user-event v14] React version: [e.g., React 19] Here is the full component source: [PASTE FULL COMPONENT CODE] Do the following: 1. Write a complete test file covering: a. The happy path (expected user interactions and outputs) b. Edge cases: empty arrays, null/undefined props, loading states, error states c. Boundary values for any numeric or string inputs 2. Use getByRole and getByLabelText queries - avoid getByTestId unless no semantic alternative exists. 3. Mock external sources (network calls, timers, services) only; test observable behaviors without asserting internal variables. 4. If the component involves layout-dependent interactions (e.g., drag, click coordinates), simulate getBoundingClientRect with realistic values. 5. After the test file, list every edge case you identified and explain why each one was included. Why This Prompt Works
Being specific about the framework and library versions upfront avoids mismatches that can lead to errors – Vitest and Jest, for example, have subtle differences in their APIs. Encouraging the use of getByRole and getByLabelText ensures the tests align with actual user behavior and remain resilient to code refactoring. Separating happy-path tests from edge-case scenarios forces the AI to dig deeper, covering a broader range of possibilities. Finally, requiring an explanation of the edge cases provides transparency and helps identify any missed scenarios.
Speeding Up Slow List Rendering Without Virtualization Libraries
Imagine a list that works fine with 50 items but struggles when scaled to 1,000 rows, freezing on every keystroke. While virtualization libraries can help, they aren’t always the best choice for lists under 10,000 items – especially when preserving native browser features and accessibility is a priority.
One simple yet powerful solution is content-visibility: auto. This CSS property allows the browser to skip layout and paint work for elements that are off-screen, making rendering much faster. For example, a web.dev case study from April 2026 showed a 7× improvement on a travel-blog page after applying this property. The initial render time dropped from 232ms to just 30ms, all without altering the DOM structure [11]. However, there’s a catch: you need to pair it with contain-intrinsic-size (e.g., contain-intrinsic-size: 0 100px) to prevent scrollbars from shifting as elements enter the viewport.
"The core insight: users can only see one viewport at a time, so anything else is wasted layout, paint, and memory." – Sujeet Jaiswal, Principal Software Engineer [11]
Fixing Referential Instability
Another common performance bottleneck is referential instability. Inline objects or arrow functions in JSX (like style={{ color: 'red' }}) create new references on every render, which can break React.memo optimizations. To fix this, move these definitions outside the JSX block. For lists that update dynamically (e.g., filtering or sorting), using useTransition can help prioritize input responsiveness over re-rendering the entire list.
Chunked Rendering for Very Large Lists
For massive, static datasets where pagination isn’t an option, chunked rendering with requestAnimationFrame offers a practical alternative. Instead of rendering all items at once, you can process them in batches of 50–100 per frame. This keeps individual tasks under the 50ms "Long Task" threshold, ensuring the browser remains responsive to user input [12]. While this approach requires more manual effort than content-visibility, it provides precise control without relying on external libraries.
📋 Copy-Paste Prompt
Building on the above optimization strategies, you are a senior frontend engineer optimizing list rendering performance in React. Component name: [COMPONENT_NAME] Approximate list size: [e.g., 500 / 2,000 / 10,000 items] React version: [e.g., React 18 / React 19] Can pagination be introduced? [Yes / No] Are virtualization libraries allowed? [Yes / No] Here is the full component source: [PASTE FULL COMPONENT CODE] Do the following: 1. List rendering inefficiencies: inline literals in JSX, context triggering unnecessary re-renders, improper memoization hooks usage, and use of unstable keys. 2. Based on the list size provided, recommend the most appropriate strategy from: - content-visibility: auto with contain-intrinsic-size (for 1,000–10,000 items) - useTransition or useDeferredValue for filtering/sorting updates - requestAnimationFrame chunked rendering (for static, large datasets) - Pagination or IntersectionObserver-based infinite scroll 3. Rewrite the component applying your recommended fixes. 4. Add a CSS block if content-visibility or CSS containment is part of the solution. 5. After the rewrite, list each change made and explain the specific performance problem it solves. Why This Prompt Is Effective
This prompt works because it starts by asking for the list size, which helps tailor the solution – whether it’s applying content-visibility, chunked rendering, or pagination. By explicitly listing inefficiencies (e.g., inline literals, unstable keys), it ensures a thorough diagnostic approach rather than a generic rewrite. Requiring an explanation of each change also makes it easier to understand the optimizations and their impact.
5. Debugging CSS Layout Issues Across Breakpoints
CSS layout problems often behave inconsistently across devices. For instance, what looks fine on a laptop might break on a mobile screen. Common culprits include fixed pixel widths, missing box-sizing: border-box, rigid flex items, or forgetting the viewport meta tag.
Here’s a quick trick: add a red border (border: 1px solid red) to the elements you’re debugging. This helps you spot overflow or container sizing problems. If you’re working with flexbox or grid, Chrome DevTools can be your best friend. Clicking the "flex" or "grid" badge in the Elements panel shows overlays for axes, tracks, and gaps, making invisible issues visible.
A specific example is iOS Safari’s 100vh bug, which can trigger unwanted overflow. A better option is using dvh. Another iOS quirk? Inputs with a font size under 16px cause auto-zoom, which can mess up layouts. These platform-specific details can save you hours of frustration.
When reporting layout bugs, vague descriptions like "it’s broken on mobile" won’t cut it. Instead, give detailed feedback. Name the problematic element, share its CSS values from the inspector, and explain exactly how it should behave. This approach can slash debugging time by as much as 60% [14].
"Responsive debugging is less about memorizing breakpoints and more about removing rigid layout assumptions." [13]
📋 Copy-Paste Prompt
You are a senior frontend engineer debugging a CSS layout issue that appears across specific breakpoints. Component or page name: [COMPONENT_OR_PAGE_NAME] CSS framework or methodology: [e.g., Tailwind CSS / plain CSS / CSS Modules] Affected breakpoints: [e.g., mobile < 640px / tablet 768px / all below 1024px] Browser(s) where the issue appears: [e.g., iOS Safari / Chrome Android / all] Expected behavior: [EXPECTED_BEHAVIOR] Actual behavior: [ACTUAL_BEHAVIOR - include specific symptoms, e.g., "cards overlap at 768px", "horizontal scrollbar appears on mobile", "sticky header stops working"] Relevant HTML structure: [PASTE HTML] Relevant CSS (including media queries): [PASTE CSS] 1. Identify the root cause of the layout issue, referencing the specific CSS property or structural pattern responsible. 2. Check for these common culprits: fixed pixel widths causing overflow, missing box-sizing: border-box, flex/grid items not shrinking (min-width: 0 fix), missing viewport meta tag, iOS-specific bugs (100vh, input font-size < 16px), and specificity conflicts overriding media queries. 3. Provide a corrected version of the CSS and HTML. 4. If the fix involves a mobile-specific quirk (iOS Safari, scrollbar width consuming ~16px of viewport space, device pixel ratio), explain why it only appears on that platform. 5. List each change made and what it solves. Why This Prompt Is Effective
This prompt works because it demands precision. By clearly outlining the expected behavior, actual behavior, and providing relevant code snippets, it eliminates guesswork. It also guides the debugging process by pointing out common issues like box-sizing or platform-specific quirks. Plus, asking for platform-specific explanations ensures subtle browser differences are addressed, leading to more accurate fixes. This structured approach can turn a frustrating hour-long task into a quick, efficient solution.
6. Migrating a Component Between State Management Libraries
Switching state management libraries might sound straightforward, but it often turns into a time-consuming process. One of the biggest mistakes teams make is attempting a full migration all at once. This approach can lead to regressions and slow down feature delivery [15].
A smarter strategy is to migrate incrementally. Start with a low-risk part of the application. Most state management libraries can coexist during a transition, which allows for uninterrupted development of new features [15]. For example, you can focus on migrating UI state first, while using a separate tool like TanStack Query to handle API data [15].
"Match the tool to the state category." – Sujeet Jaiswal, Principal Software Engineer [17]
If you’re migrating to Zustand v5, a key tip is to wrap object selectors in useShallow. This prevents infinite re-render loops caused by the default Object.is equality checks [15].
📋 Copy-Paste Prompt
Here’s a detailed prompt to guide you through an incremental migration process:
You are a senior frontend engineer migrating a React component from one state management library to another. Component name: [COMPONENT_NAME] Current state management library: [e.g., Redux Toolkit / MobX / Context API] Target state management library: [e.g., Zustand / Jotai / TanStack Query] React version: [e.g., React 18.3] SSR environment: [Yes - Next.js / No] Current component code (include store slice, selectors, and dispatch calls): [PASTE CURRENT COMPONENT CODE] Current store slice or context definition: [PASTE STORE SLICE / CONTEXT] Migration constraints: - Public component props must remain identical (do not change the API) - All existing tests must pass without modification - If a block of logic cannot be safely migrated, leave a // TODO-MIGRATE: [reason] comment instead of guessing 1. Classify the state in this component: - Client state (UI, auth, preferences) - Server state (API responses, cache) - Ephemeral state (local component state only) Recommend whether server state should move to TanStack Query instead of the target library. 2. Rewrite the component using the target library. Replace: - useSelector / useStore calls → granular selectors in the new library - dispatch / action calls → new store methods - Any middleware (thunks, sagas) → equivalent pattern in the target library 3. If migrating to Zustand v5: wrap all object selectors in useShallow to prevent infinite re-render loops caused by Object.is equality checks. If migrating to Jotai: define all atoms at module scope, not inside the component. 4. If SSR is enabled: ensure the store is created per-request using a Context pattern to prevent state leaking between users. 5. List every change made, what it replaces, and why. 6. Mark any unsafely migrated logic with a // TODO-MIGRATE comment. Why This Prompt Works
This approach emphasizes a step-by-step transition rather than a risky overhaul. It starts with classifying the state, which helps developers make informed choices about handling server state – a common challenge during migrations. The inclusion of a // TODO-MIGRATE option ensures complex logic isn’t guessed at, reducing potential errors [16]. Additionally, maintaining the public component API ensures dependent code remains functional, a practice often referred to as a "signature audit" [16]. This structured, incremental strategy makes the migration process safer and more transparent.
7. Generating TypeScript Types from an API Response
Manually creating TypeScript types for API responses can be both time-consuming and prone to mistakes. Accurate types are essential – they shield your production code from unexpected issues and help maintain stability, especially in fast-moving development cycles. For instance, in a 2026 project shared by frontend engineer Segev Sinay, a review of 23 API endpoints revealed that 7 had mismatched response types. These mismatches led to dropped data, such as fields incorrectly typed as strings instead of objects, and even caused a production crash when a required field unexpectedly returned null [18].
The key isn’t just using a type generator but crafting a reliable prompt based on real-world data. API documentation often falls out of sync, but network tab responses provide an accurate reflection of how the API truly behaves.
"Documentation lies. API responses do not." – Segev Sinay, Frontend Engineer [18]
To ensure reliable type definitions, don’t settle for just the "happy path" response. Include 3–5 samples with edge cases like empty arrays, nullable fields, or varying user states. This approach allows the AI to correctly identify optional properties (?:) and union types, avoiding risky assumptions.
📋 Copy-Paste Prompt
You are a senior TypeScript engineer generating type definitions from real API response samples. Endpoint: [ENDPOINT_URL or ENDPOINT_NAME] HTTP method: [GET / POST / etc.] Auth context: [e.g., authenticated user / public / admin] Paste 3–5 actual API response samples from the network tab. Include at least one edge case: empty arrays, null fields, or a different user state if applicable. [PASTE SAMPLE 1 - happy path] [PASTE SAMPLE 2 - edge case, e.g., null fields or empty arrays] [PASTE SAMPLE 3 - optional: different user role or state] Generate the following strictly in TypeScript without using `any`: 1. Named TypeScript interfaces using PascalCase. Use the suffix `Response` for the root type (e.g., `UserResponse`) and `Item` for array elements (e.g., `OrderItem`). Extract every nested object into its own named interface - do not inline nested shapes. 2. For each field, mark as optional (`?:`) if absent in any sample, nullable (`T | null`) if null appears, or both if applicable. Use literal union types for fields with a small set of distinct string values (e.g., "active", "inactive", "trial"). 3. For empty arrays (`[]`), flag them with a comment: // TODO: Verify element type - unknown[] 4. For ISO date strings, type as `string` and add a JSDoc comment: /** ISO 8601 date string */ 5. For empty objects (`{}`), use `Record<string, unknown>`. 6. If the same nested shape appears more than once, extract it into a single reusable interface. 7. Generate a generic wrapper if a pagination or envelope pattern is present (e.g., `ApiResponse<T>` or `PaginatedResponse<T>`). 8. Generate a corresponding Zod schema for the root type, using `z.infer<typeof schema>` to derive the TypeScript type. This is for runtime validation at the network boundary. 9. Add a JSDoc comment to each field based on its name and shape to improve IDE autocomplete. List: - Every field marked optional and why - Every field marked nullable and why - Any fields you could not confidently type, with a // TODO comment This prompt ensures a thorough and precise approach to generating TypeScript types, directly addressing common pitfalls.
Why This Prompt Works
The structure of this prompt enforces strict TypeScript practices, eliminating the need for vague any types. It carefully differentiates between optional and nullable fields, a distinction that is often overlooked but critical for clarity. By including Zod schema generation, it adds a layer of runtime validation, catching type mismatches early. Additionally, the use of // TODO flags for ambiguous fields or empty arrays ensures that any uncertainties are clearly documented for further review, making the process both rigorous and transparent.
8. Writing ARIA Markup for a Custom Interactive Component
Accessibility is one area where AI-generated UI code often stumbles. A study conducted in 2025 revealed that 73% of AI-generated React applications failed to meet WCAG AA standards on the first try. This is largely because over 96% of the top one million homepages globally have detectable accessibility issues – and AI learns from this flawed foundation [23]. However, when accessibility-specific prompts were used, the failure rate dropped significantly to just 18% [23]. As Pranay Joshi, an AI Coach at Vibe Coder, explains:
"The AI is not ignoring accessibility on purpose. It is reflecting the statistical reality of how most code is written." – Pranay Joshi, AI Coach, Vibe Coder [22]
The solution lies in crafting a prompt that provides the AI with clear, detailed instructions: prioritize semantic HTML, use ARIA only when native elements fall short, define keyboard interactions step by step, and explicitly outline focus management. With one in four adults in the U.S. living with a disability [19], and automated tools like axe-core catching only 30–40% of accessibility issues [19][21], the rest comes down to writing clean, accessible code from the start. The following prompt is designed to help frontend engineers produce accessible, ready-to-use components while avoiding costly rewrites later.
📋 Copy-Paste Prompt
You are a senior frontend engineer and accessibility specialist. Write accessible markup and interaction logic for a custom interactive component. Component type: [e.g., accordion / modal dialog / tab panel / menu button / toggle switch / combobox] Framework: [React / Vue / plain HTML+JS] Styling approach: [Tailwind / CSS Modules / styled-components / none] Headless library preference: [Radix UI / Headless UI / React Aria / none] Component description: [Describe what the component does, how it opens/closes, and what content it contains. Include any dynamic content updates.] Follow these requirements: 1. SEMANTICS FIRST: Use native HTML elements wherever possible (<button>, <details>, <dialog>). Only apply ARIA roles when no native element provides the required semantics. 2. ARIA ATTRIBUTES: Apply appropriate ARIA attributes - role, properties, and states - only when native elements cannot provide the required semantics. Include: - aria-expanded / aria-selected / aria-checked (as applicable) - aria-controls pointing to the controlled element's ID - aria-labelledby or aria-label on every interactive element - aria-haspopup if the component triggers a menu or dialog 3. KEYBOARD INTERACTION: Define all necessary keyboard handlers: - Tab / Shift+Tab: move focus between focusable elements - Enter / Space: activate buttons and toggles - Arrow keys: navigate within composite widgets (tabs, menus) - Escape: close overlays, menus, and dialogs For composite widgets, use roving tabindex: set tabindex="0" on the active item, tabindex="-1" on all others. 4. FOCUS MANAGEMENT: - On open: move focus to the first interactive element inside the component (or the component itself if it is a dialog). - On close: return focus to the trigger element that opened it. - For modal dialogs: trap focus within the dialog while it is open. 5. HIDDEN CONTENT: Apply aria-hidden="true" to collapsed panels or closed menus so they are unreachable by screen readers. Never apply aria-hidden to focusable elements. 6. LIVE REGIONS: If the component displays dynamic status updates (e.g., "Saved", loading state), use role="status" for non-urgent messages and role="alert" for critical errors. 7. MOTION: Wrap animations in a prefers-reduced-motion media query or CSS class and disable them when the user has requested reduced motion. 8. AVOID REDUNDANT ARIA: Do not add role="button" to a native <button>. Do not add aria-label to elements with clear visible text unless the visible text is insufficient. After generating the component, do the following: - Walk through what a VoiceOver or NVDA user would hear when they Tab into the component, interact with it, and close it. List every interactive element, confirm it has an accessible name, and flag any state not announced to assistive technology. - Note any keyboard interaction that is missing or incomplete. Why This Prompt Works
This prompt is effective because it tackles frequent accessibility problems head-on by enforcing the First Rule of ARIA: use native HTML elements first, and only apply ARIA roles when absolutely necessary. This approach prevents many common AI-generated accessibility errors [19][20]. Detailing keyboard interactions is also critical since, as A11yPath emphasizes, "ARIA does not add behavior. It only adds semantics" [20]. The prompt explicitly requires the AI to include JavaScript for interaction logic. Finally, the step requiring an audit of the component using a screen reader simulation ensures that all interactive elements are accessible and labeled correctly – something automated tools often miss [24][25].
Spotting Performance Bottlenecks in a Component Before Profiling
When it comes to performance issues in React apps, the symptoms – like laggy scrolling, delayed interactions, or unresponsive UI – are easy to spot. But finding the underlying cause? That’s the tricky part. As Steve Kinney puts it:
"Performance issues in React apps are like medical mysteries – the symptoms are obvious (janky scrolling, slow interactions, or unresponsive UI), but the root cause could be anywhere." – Steve Kinney [26]
The good news? Most performance problems in React follow familiar patterns. These include things like overly broad Context Providers, inline objects or functions that disrupt React.memo, heavy computations in the render body, or unoptimized event handlers firing too often. For instance, rendering a list of 5,000 DOM nodes is a classic example of what developers call a performance “footgun” [27]. The key is identifying these patterns early – before you even fire up the React Profiler.
📋 Copy-Paste Prompt
Here’s a practical prompt you can use to pinpoint potential bottlenecks in your component:
You are a senior React performance engineer. Analyze the component code below and identify likely performance bottlenecks before profiling. Component code: [Paste your full component code here, including imports] Observed symptoms: [Describe what you see - e.g., "47 components re-render on a single keystroke", "scroll stutters with 200 items", "UI freezes for ~300ms after clicking the filter button"] React version: [e.g., 18.3 / 19.x] Is React Compiler enabled? [Yes / No] Is this running in development or production mode? [Development / Production] Analyze the code for the following patterns and flag any you find: 1. RENDER-STORM TRIGGERS: Inline object, array, or function definitions passed as props (e.g., style={{ }} or onClick={() => {}}) that create new references on every render. Focus on how these affect performance symptom tracing before profiling. 2. CONTEXT BLOAT: A Context Provider that wraps a large subtree and updates frequently. Flag components that consume the context but only use a small slice of its value. 3. EXPENSIVE RENDER LOGIC: Heavy computations (filtering, sorting, transforming large arrays) placed directly in the component body instead of inside useMemo. 4. HIGH-FREQUENCY EVENT HANDLERS: scroll, resize, mousemove, or input handlers that trigger setState on every event without debouncing or throttling. 5. N+1 RENDERING: Multiple sequential setState calls inside a loop or after multiple awaits that could be batched into a single update. 6. NESTED COMPONENT DEFINITIONS: A component defined inside another component's render body, causing full remounts instead of re-renders. 7. UNSTABLE useEFFECT DEPENDENCIES: Note any useEffect dependencies that change on every render, which can indicate unnecessary re-executions when profiling. 8. UNVIRTUALIZED LARGE LISTS: Arrays rendered directly with .map() that could exceed 100+ items in production. For each identified pattern, quote the exact line(s) where it occurs and explain its performance impact. Then provide: - The minimal fix (useMemo, useCallback, debounce, context splitting, state colocation, etc.) - The likely impact: High / Medium / Low Finally, rank the top three issues by impact and indicate which to fix first. Why This Prompt Works
This approach is effective because it demands precision. By asking for specific symptoms – like “47 re-renders on one keystroke” – you give the AI a clear chain of events to investigate, rather than a vague problem to generalize [5]. Requiring it to quote exact lines of code ensures the feedback is directly tied to your component, avoiding generic advice. And by including an impact rating, the output stays actionable, helping you prioritize fixes.
Pranay Joshi, VP of Product & Engineering, highlights this need for targeted insights:
"AI performance prompts are the missing layer between ‘it works’ and ‘it works fast.’ The default output from every AI tool optimizes for correctness and readability, not for speed." – Pranay Joshi, VP of Product & Engineering [28]
One last tip: always clarify whether you’re running in development or production mode. React in development can be two to five times slower than in production [27], so some bottlenecks you see locally might not exist in production – and vice versa. Providing that context helps the AI focus on the real problems, not the noise. This way, you can streamline your optimizations and focus on fixes that truly matter.
Wrapping Up
These nine copy-paste prompts tackle some of the most time-consuming frontend tasks – debugging re-renders, migrating state libraries, generating TypeScript types, and writing accessible markup. While not the most glamorous parts of development, these tasks are essential. Having a tailored prompt for each one can make a world of difference.
The real advantage of structured prompts over quick one-liners isn’t just better output – it’s the time you save fixing errors. As Mohit Verma from Prepare Frontend notes:
"A well-crafted prompt can generate production-ready code in seconds, while a vague prompt produces generic, unusable results." – Mohit Verma, Prepare Frontend [30]
Microsoft research backs this up, showing that teams using structured prompts were 3x more productive than those relying on casual, unstructured ones [29]. This productivity boost becomes even more apparent with repetitive tasks.
To maximize efficiency, save your prompts in a shared toolkit. Whether you use Notion, VS Code snippets, or a team playbook, having instant access to these prompts allows you to go from problem to solution in under 30 seconds [1]. Over time, as your prompts reflect your specific tech stack, TypeScript configurations, and accessibility standards, they evolve into a powerful knowledge resource.
"Templates encode lessons you have already learned… Over weeks, your templates become a compounding knowledge base." – Vibe Coder Blog [2]
FAQs
What should I include in my prompt to get non-generic, code-specific fixes?
To get accurate, code-focused solutions, it’s all about being specific. Start by assigning the AI a role, like a "senior frontend engineer", to set the context. Mention your tech stack clearly – whether it’s React, Vue, Python, or something else. Include error messages and share relevant code snippets to give the AI a clear picture of the problem.
You can also outline any constraints, such as avoiding the use of any types in TypeScript or steering clear of external libraries. Be clear about what the AI should avoid doing. Lastly, specify how you’d like the response formatted – whether that’s a runnable file, a detailed explanation, or step-by-step guidance to resolve the issue.
How can I verify AI-generated tests actually catch real bugs?
To make AI-generated tests effective at catching real bugs, prioritize behavior over implementation. This means aligning tests with specific business requirements rather than the underlying code structure. Adopt an adversarial mindset – challenge the AI by prompting it to explore potential failure scenarios like null inputs, edge cases, or race conditions.
It’s also crucial to validate tests through execution, ensuring they properly check UI interactions or outputs as intended. Keep a detailed log of failed assumptions to track recurring issues and address them systematically.
When should I use content-visibility or chunked rendering instead of list virtualization?
When dealing with very large datasets – think lists with over 1,000 items – leveraging list virtualization can significantly improve performance. By rendering only the visible items within the viewport, you minimize the DOM size, which is especially crucial for interactive or mobile-heavy lists where smooth scrolling and responsiveness matter.
For static, long documents or feeds, consider using the CSS property content-visibility: auto. This defers the rendering of off-screen content, which can enhance performance by reducing the initial rendering workload. To prevent layout shifts, pair it with contain-intrinsic-size. While this CSS-only method is simpler to implement, it’s not ideal for lists that are highly dynamic or interactive.


Leave a Reply